Exhibit 99.2
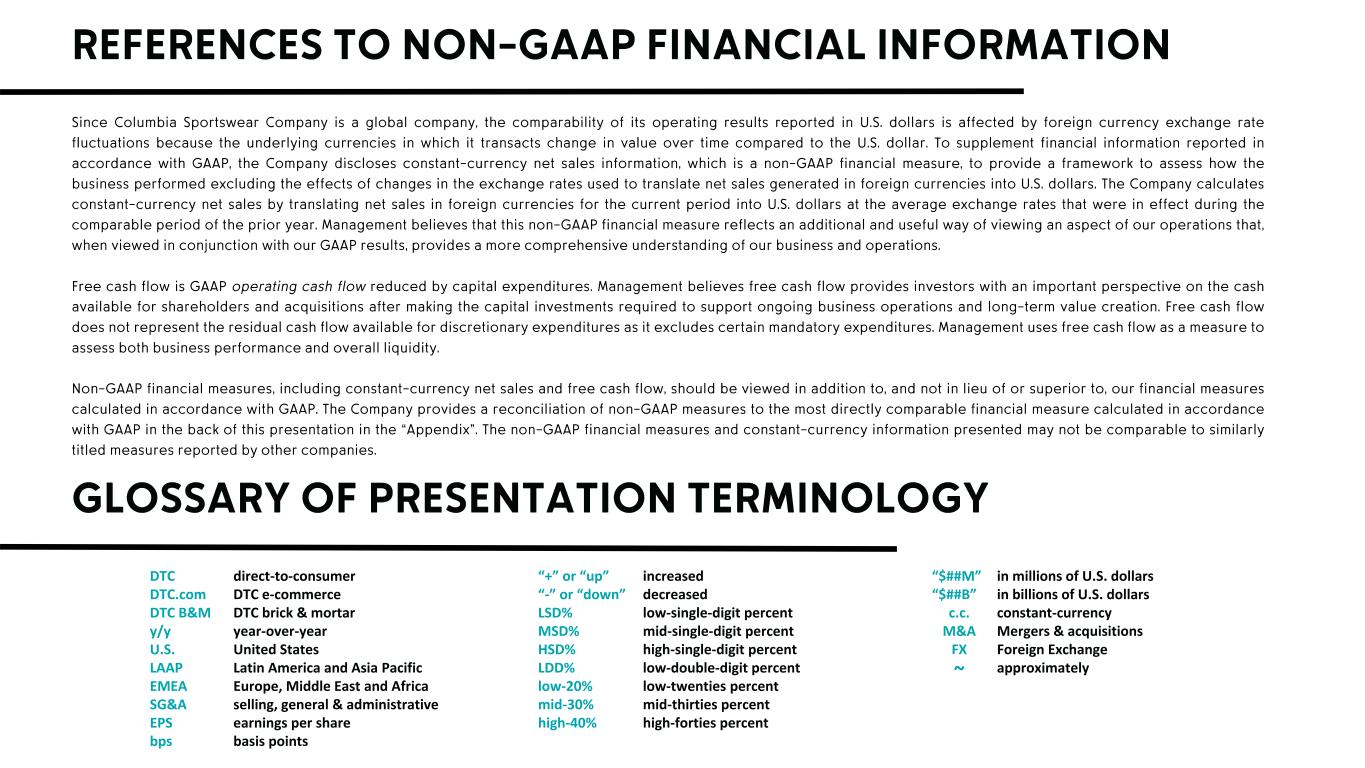
DTC DTC.com DTC B&M y/y U.S. LAAP EMEA SG&A EPS bps direct-to-consumer DTC e-commerce DTC brick & mortar year-over-year United States Latin America and Asia Pacific Europe, Middle East and Africa selling, general & administrative earnings per share basis points “+” or “up” “-” or “down” LSD% MSD% HSD% LDD% low-20% mid-30% high-40% increased decreased low-single-digit percent mid-single-digit percent high-single-digit percent low-double-digit percent low-twenties percent mid-thirties percent high-forties percent “$##M” “$##B” c.c. M&A FX ~ in millions of U.S. dollars in billions of U.S. dollars constant-currency Mergers & acquisitions Foreign Exchange approximately


• • • • •
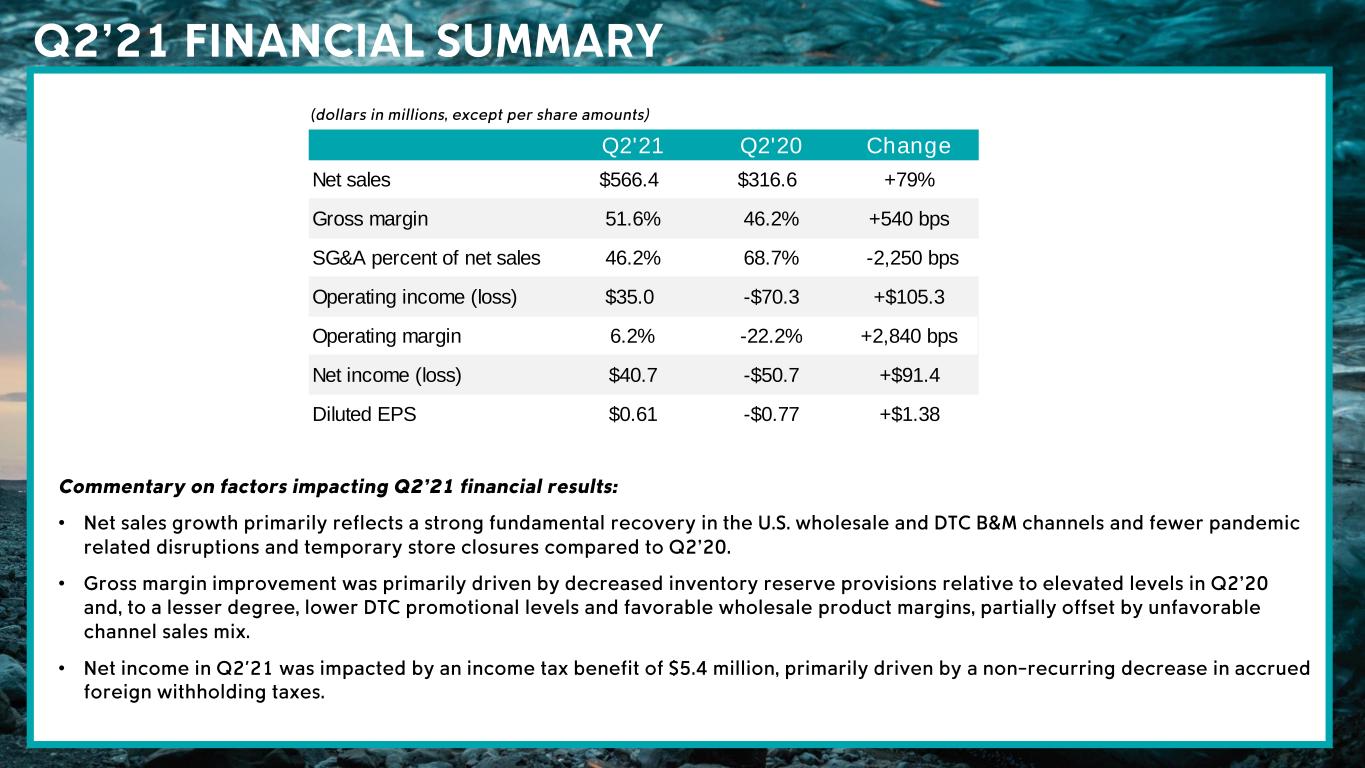
• • • Q2'21 Q2'20 Change Net sales $566.4 $316.6 +79% Gross margin 51.6% 46.2% +540 bps SG&A percent of net sales 46.2% 68.7% -2,250 bps Operating income (loss) $35.0 -$70.3 +$105.3 Operating margin 6.2% -22.2% +2,840 bps Net income (loss) $40.7 -$50.7 +$91.4 Diluted EPS $0.61 -$0.77 +$1.38
• • • • • • • •
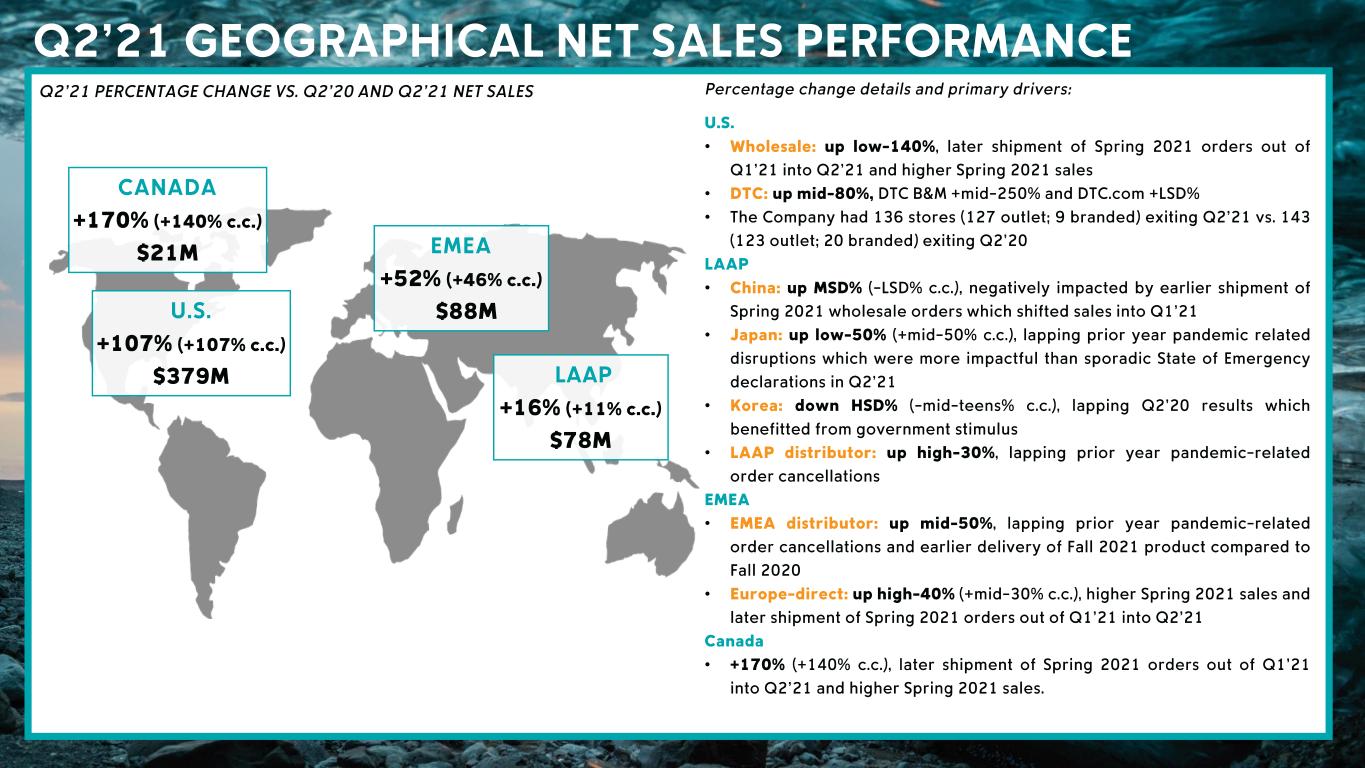
• • • • • • • • • •
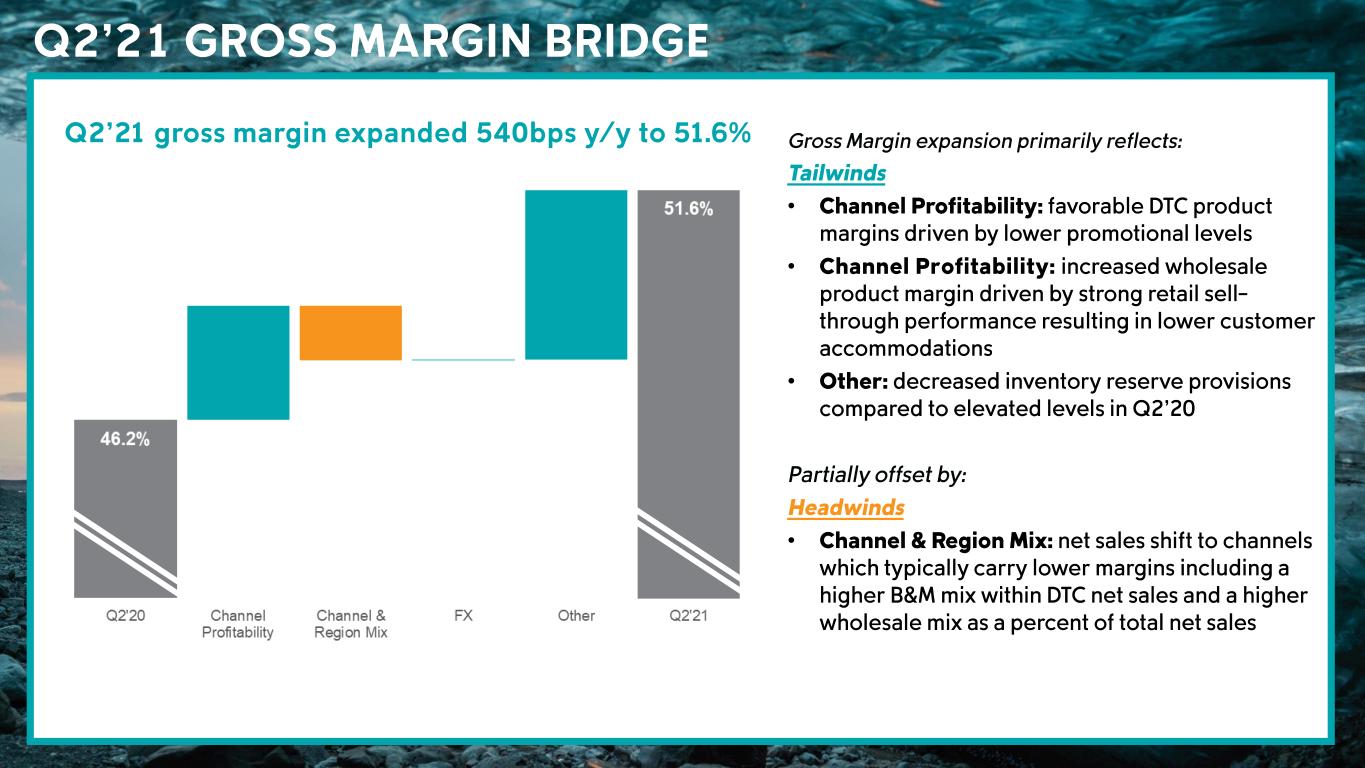
• • • •
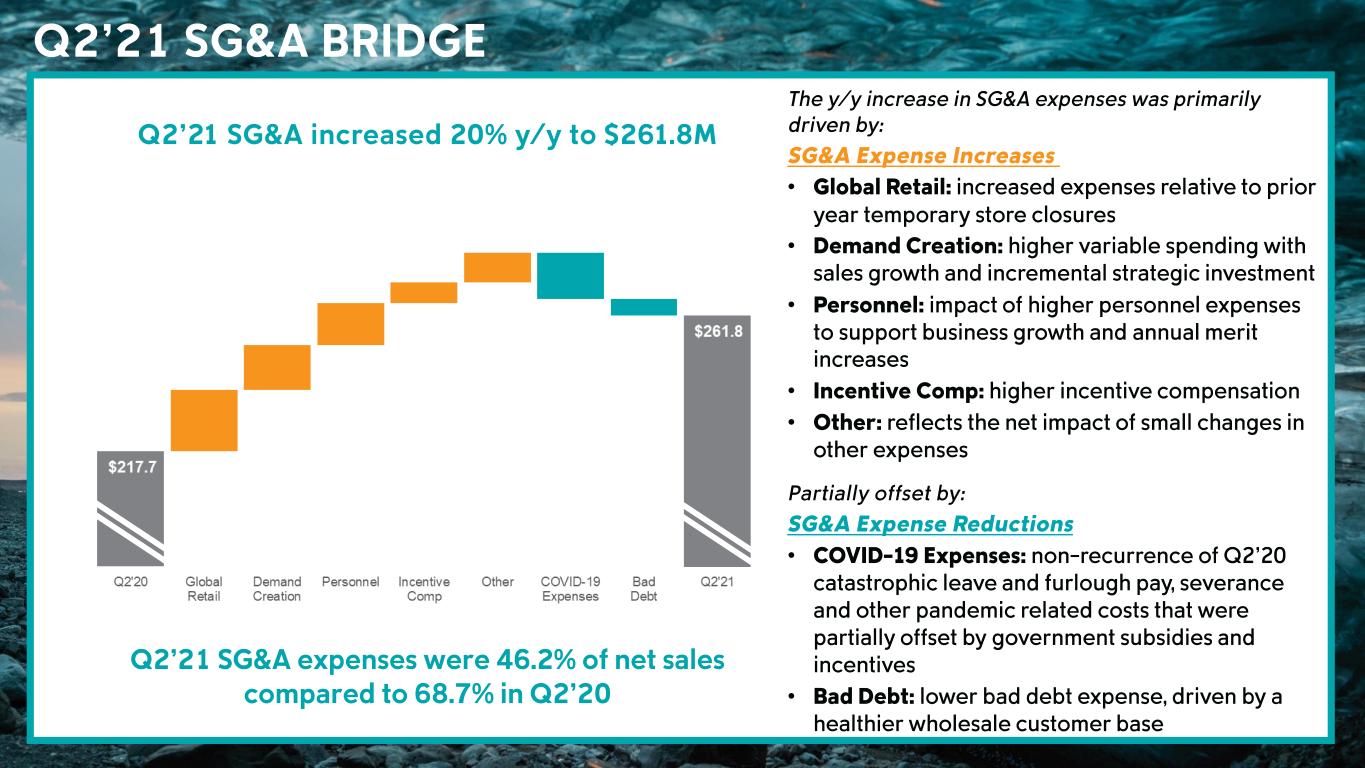
• • • • • • •
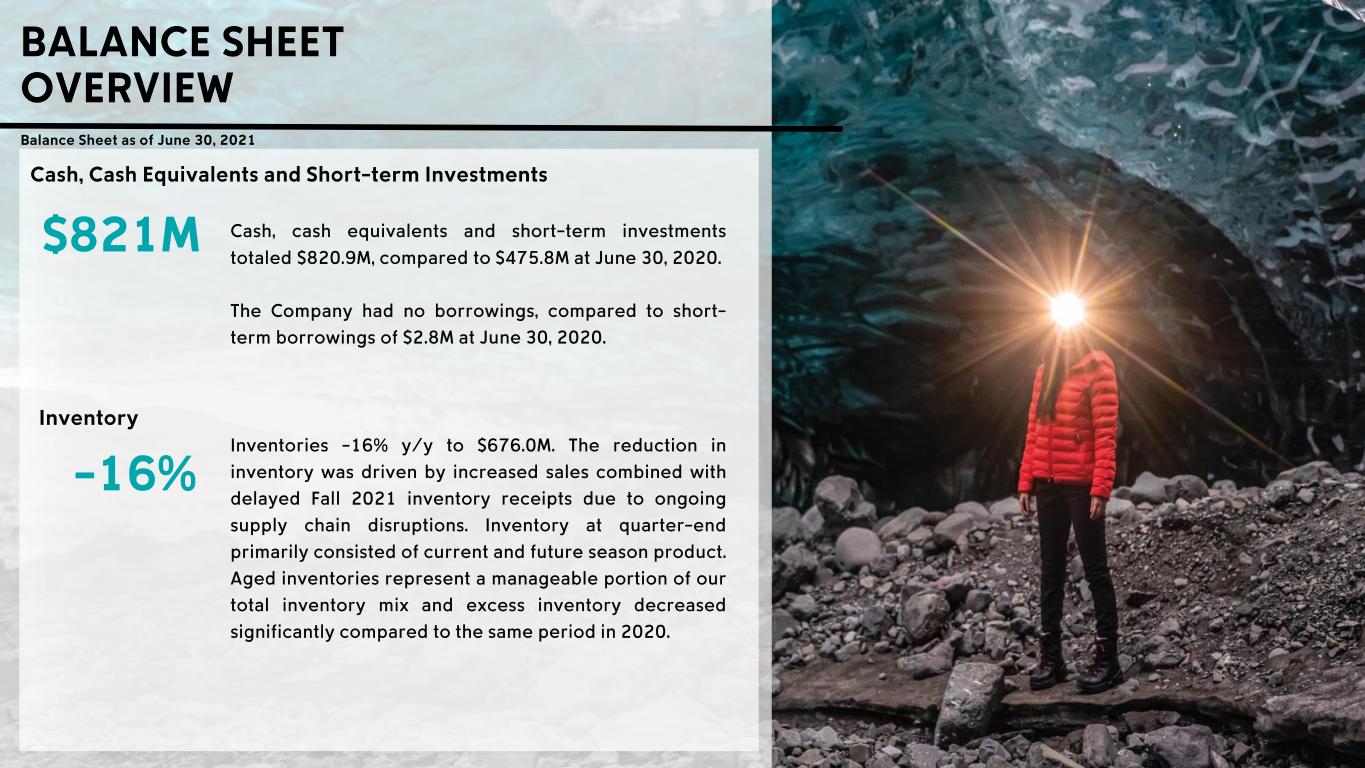
• • • • • • • •
• • • • • • − − • • • • • • • • • • •
• • • • • •

