UNITED STATES
SECURITIES AND EXCHANGE COMMISSION
Washington, DC 20549
FORM 10-K
| x | ANNUAL REPORT PURSUANT TO SECTION 13 OR 15(D) OF THE SECURITIES EXCHANGE ACT OF 1934 |
| For the fiscal year ended December 31, 2008 |
OR
| ¨ | TRANSITION REPORT PURSUANT TO SECTION 13 OR 15(D) OF THE EXCHANGE ACT OF 1934 |
| For the transition period from to |
Commission File Number 0-23939
COLUMBIA SPORTSWEAR COMPANY
(Exact name of registrant as specified in its charter)
| Oregon | 93-0498284 | |
| (State or other jurisdiction of incorporation or organization) |
(IRS Employer Identification Number) | |
| 14375 NW Science Park Drive Portland, Oregon | 97229 | |
| (Address of principal executive offices) | (Zip Code) | |
(503) 985-4000
(Registrant’s telephone number, including area code)
Securities registered pursuant to Section 12(b) of the Act:
| Title of each class |
Name of each exchange on which registered | |
| Common Stock | The NASDAQ Stock Market LLC |
Securities registered pursuant to Section 12(g) of the Act: None
Indicate by check mark if the registrant is a well-known seasoned issuer, as defined in Rule 405 of the Securities Act. Yes ¨ No x
Indicate by check mark if the registrant is not required to file reports pursuant to Section 13 or Section 15(d) of the Act. Yes ¨ No x
Indicate by check mark whether the registrant (1) has filed all reports required to be filed by Section 13 or 15(d) of the Securities Exchange Act of 1934 during the preceding 12 months (or for such shorter period that the registrant was required to file such reports), and (2) has been subject to such filing requirements for the past 90 days. Yes x No ¨
Indicate by check mark if disclosure of delinquent filers pursuant to Item 405 of Regulation S-K is not contained herein, and will not be contained, to the best of registrant’s knowledge, in definitive proxy or information statements incorporated by reference in Part III of this Form 10-K or any amendment to this Form 10-K. ¨
Indicate by check mark whether the registrant is a large accelerated filer, an accelerated filer, a non-accelerated filer, or a smaller reporting company. See the definitions of “large accelerated filer,” “accelerated filer” and “smaller reporting company” in Rule 12b-2 of the Exchange Act.
| Large accelerated filer ¨ | Accelerated filer x | |||
| Non-accelerated filer ¨ (Do not check if a smaller reporting company) | Smaller reporting company ¨ | |||
Indicate by check mark whether the registrant is a shell company (as defined in Rule 12b-2 of the Exchange Act). Yes ¨ No x
The aggregate market value of the voting common stock held by non-affiliates of the registrant as of June 30, 2008, the last business day of the registrant’s most recently completed second fiscal quarter, was $455,937,000 based on the last reported sale price of the Company’s Common Stock as reported by the NASDAQ Global Select Market System on that day.
The number of shares of Common Stock outstanding on February 13, 2009 was 33,868,290.
Part III is incorporated by reference from the registrant’s proxy statement for its 2009 annual meeting of shareholders to be filed with the Commission within 120 days of December 31, 2008.
COLUMBIA SPORTSWEAR COMPANY
DECEMBER 31, 2008
| Item |
Page | |||
| PART I | ||||
| Item 1. |
2 | |||
| Item 1A. |
9 | |||
| Item 1B. |
16 | |||
| Item 2. |
16 | |||
| Item 3. |
17 | |||
| Item 4. |
17 | |||
| Item 4A. |
17 | |||
| PART II | ||||
| Item 5. |
20 | |||
| Item 6. |
23 | |||
| Item 7. |
Management’s Discussion and Analysis of Financial Condition and Results of Operations |
24 | ||
| Item 7A. |
39 | |||
| Item 8. |
39 | |||
| Item 9. |
Changes in and Disagreements with Accountants on Accounting and Financial Disclosure |
68 | ||
| Item 9A. |
68 | |||
| Item 9B. |
70 | |||
| PART III | ||||
| Item 10. |
71 | |||
| Item 11. |
71 | |||
| Item 12. |
Security Ownership of Certain Beneficial Owners and Management and Related Stockholder Matters |
71 | ||
| Item 13. |
Certain Relationships and Related Transactions, and Director Independence |
72 | ||
| Item 14. |
72 | |||
| PART IV | ||||
| Item 15. |
73 | |||
| 75 | ||||
PART I
| Item 1. | BUSINESS |
General
Founded in 1938 in Portland, Oregon, as a small, family-owned, regional hat distributor and incorporated in 1961, Columbia Sportswear Company has grown to become a global leader in the design, sourcing, marketing and distribution of active outdoor apparel, footwear and related accessories and equipment. Unless the context indicates otherwise, the terms “we”, “us”, “our”, “the Company” and “Columbia” refer to Columbia Sportswear Company and its consolidated subsidiaries.
As one of the largest outdoor apparel and footwear companies in the world, our products have earned an international reputation for innovation, quality, performance, durability, functionality, dependability and value. In addition to our flagship Columbia Sportswear® brand, we also design, develop, market and distribute active outdoor apparel, footwear and related accessories and equipment under the Mountain Hardwear®, Sorel®, Montrail® and Pacific Trail® brands. Our brands complement each other to address the diverse outdoor performance needs of a wide variety of outdoor consumer segments. We have sought to leverage our brand equity by expanding directly and through licensees into related outdoor and lifestyle merchandise categories, promoting a “head-to-toe” outfitting concept.
Each of our brands is distributed through a mix of wholesale distribution channels, independent distributors, our own retail stores and licensees. In 2008, we distributed our products to over 9,000 wholesale customers in over 100 countries. We employ creative marketing strategies designed to increase demand and reinforce consumer awareness of each of our brands. All of our products are manufactured by independent contractors in facilities located outside the United States.
As a consumer products company, the popularity of outdoor activities and changing design trends affect the desirability of our products. Therefore, we seek to influence, anticipate and respond to trends and shifts in consumer preferences by adjusting the mix of available product offerings, developing new products with innovative performance features and designs, and by creating persuasive and memorable marketing communications to drive consumer awareness and demand. Failure to respond to consumer needs and preferences in a timely and adequate manner could have a material adverse effect on our sales and profitability.
Our business is subject to many risks and uncertainties that may have a material adverse effect on our financial condition, results of operations or cash flows. Some of these risks and uncertainties are described below under Item 1A, Risk Factors.
Seasonality and Variability of Business
Our business is affected by the general seasonal trends common to the outdoor apparel industry and is heavily dependent upon discretionary consumer spending patterns. Our products are marketed on a seasonal basis and our product mix is weighted substantially toward the fall season, resulting in sales and profits being highest in the third calendar quarter. We expect the expansion of our owned retail operations to have a modest effect on the seasonality of our business, increasing the proportion of sales and profits that we generate in the fourth calendar quarter.
Results of operations in any period should not be considered indicative of the results to be expected for any future period, particularly in light of the current macro-economic environment. Sales of our products are subject to substantial cyclical fluctuation, the effects of unseasonable weather conditions, and the continued popularity of outdoor activities as part of an active lifestyle in key markets. Our net sales volumes have been affected by the volatility of the global economy, its impact on consumer purchasing patterns and placement of advanced orders, order cancellations and seasonal reorders by retailers. Sales tend to decline in periods of recession or uncertainty
2
regarding future economic prospects that affect consumer spending, particularly on discretionary items. This cyclicality and any related fluctuation in consumer demand could have a material adverse effect on our financial position, results of operations or cash flows.
For further discussion regarding the effects of the current macro-economic environment on our business, see Part II, Item 7, Management’s Discussion and Analysis of Financial Condition and Results of Operations.
Products
We provide high quality apparel, footwear, accessories and equipment for use in a wide range of outdoor activities by men, women and youth. A large percentage of our products are also worn for casual or leisure purposes. The durability, functionality and affordability of our products make them ideal for a wide range of outdoor activities. Our products serve consumers ranging from elite mountain climbers who use Columbia and Mountain Hardwear apparel and accessories, winter outdoor enthusiasts who wear Columbia and Sorel cold weather boots, hunting and fishing enthusiasts who wear our Columbia PFG® (Performance Fishing Gear) and PHG® (Performance Hunting Gear) apparel, top endurance trail runners who wear Montrail shoes, and outdoor-inspired consumers who wear Columbia sportswear and footwear for a variety of active outdoor pursuits. We also market apparel and accessories with licensed college team logos.
We categorize our merchandise in four principal categories: (1) sportswear, (2) outerwear, (3) footwear and (4) related accessories and equipment. Our product innovations and designs are inspired by the performance needs of consumers who participate in activities that we group into six end-user activity-based categories: (1) winter, (2) water, (3) trail, (4) travel, (5) fishing/hunting and (6) golf.
The following table presents the net sales and approximate percentages of net sales attributable to each of our principal product categories for each of the last three years ended December 31 (dollars in millions):
| 2008 | 2007 | 2006 | ||||||||||||||||
| Net Sales | % of Sales | Net Sales | % of Sales | Net Sales | % of Sales | |||||||||||||
| Sportswear |
$ | 540.9 | 41.0 | % | $ | 565.6 | 41.7 | % | $ | 509.1 | 39.5 | % | ||||||
| Outerwear |
491.7 | 37.3 | 497.6 | 36.7 | 496.5 | 38.6 | ||||||||||||
| Footwear |
217.2 | 16.5 | 227.4 | 16.8 | 219.7 | 17.1 | ||||||||||||
| Accessories and equipment |
68.0 | 5.2 | 65.4 | 4.8 | 62.4 | 4.8 | ||||||||||||
| Total |
$ | 1,317.8 | 100.0 | % | $ | 1,356.0 | 100.0 | % | $ | 1,287.7 | 100.0 | % | ||||||
Sportswear
We design, develop, market and distribute sportswear products for men and women under our Columbia and Mountain Hardwear brands and for youth under our Columbia brand. Our sportswear products incorporate various fabrication and construction technologies that protect consumers from the outdoor elements and enable consumers to enjoy the outdoors longer and in greater comfort year round. Our sportswear products are designed to be worn as a layering system with our outerwear and footwear products during fall and winter outdoor activities, or individually during milder weather commonly encountered in spring and summer outdoor activities such as hiking, trekking, fishing, golfing, adventure travel and water-sports. Mountain Hardwear-branded sportswear consists primarily of performance styles designed for backpacking, rock climbing and adventure sports. Our Columbia and Mountain Hardwear sportswear product assortments also include casual styles designed to appeal to a broader consumer base.
Outerwear
We design, develop, market and distribute outerwear products for men and women under our Columbia, Mountain Hardwear, Sorel and Pacific Trail brands and for youth under our Columbia and Pacific Trail brands.
3
Outerwear is our most established and iconic product category and incorporates the cumulative design, fabrication, fit and construction technologies that we have pioneered over several decades and that we continue to innovate. Our outerwear is designed to protect the wearer from the harsher inclement weather commonly encountered in fall and winter outdoor activities, such as skiing, snowboarding, hiking, hunting, fishing and adventure travel. Our Mountain Hardwear brand features technically advanced shells, down parkas and technical clothing designed for specialized outdoor activities such as mountaineering, backpacking and climbing. These products are used by elite mountaineering athletes and serious outdoor enthusiasts around the globe.
Footwear
We design, develop, market and distribute footwear products for men and women under our Columbia, Sorel and Montrail brands and for youth under our Columbia and Sorel brands. Our footwear products address the needs of outdoor consumers who participate in activities that typically involve challenging or unusual terrain that requires superior stability, cushioning and traction features. Our footwear products include durable, lightweight hiking and trekking boots, trail running shoes, rugged cold weather boots for activities on snow and ice, sandals for use in amphibious activities, and casual shoes for everyday use.
Accessories and Equipment
We design, develop, market and distribute a line of Columbia-branded accessories and equipment, including bags, packs, headwear, scarves and gloves. These products incorporate many of our performance technologies and complement our apparel and footwear collections to protect consumers during a multitude of outdoor activities in virtually any climate. We also design, develop, market and distribute a line of Mountain Hardwear accessories and equipment that includes technically-advanced tents, sleeping systems and backpacks. These equipment products are designed for mountaineering, ultralight backpacking and camping.
Licensed Products
We also license our Columbia, Pacific Trail and Sorel trademarks across a range of product categories that complement our current offerings. Licensing enables us to develop our “head-to-toe” outfitting concept by expanding the reach of our brands to appropriate and well-defined categories. In 2008, we licensed our brands in fifteen product categories, including, among others, socks, performance base layer, leather outerwear and accessories, camping gear, eyewear, home furnishings, watches and bicycles.
Product Design and Innovation
We believe our product innovation efforts are a key factor in our past and future success. We are committed to designing innovative and functional products that deliver relevant performance benefits to consumers who participate in a wide range of competitive and recreational outdoor activities, enabling them to enjoy their outdoor activities longer and more frequently. We also place significant value on product designs (the overall appearance and image of our products) that, along with technical performance features, distinguish our products in the marketplace.
Our research and development efforts involve working closely with independent fabric and component suppliers to develop products that address the unique performance problems encountered by consumers during outdoor activities. The most important performance features of our sportswear and outerwear products include water resistant or waterproof fabrics, insulation from cold ambient air temperatures and the chilling effects of wind, body warmth retention, skin protection from the damaging effects of UVA and UVB rays emitted by the sun, moisture wicking, breathability to minimize internal water vapor and moisture accumulation, protection from abrasion, liquid and stain repellency, light weight, and intelligent placement and operation of pockets and zippers for ample storage and easy access to important equipment and accessories. The most important performance features of our outdoor footwear products include cushioning, stability, superior traction in varying outdoor terrain and soil/moisture conditions, insulation from cold air or ground conditions such as snow and ice,
4
water resistant or waterproof upper fabrics, water channeling and expulsion during aquatic activities, breathability of the upper fabrics, protection from bruising and abrasion, liquid and stain repellency, and fit.
Intellectual Property
We own many trademarks, including Columbia®, Columbia Sportswear Company®, Convert®, Bugaboo®, Bugabootoo®, OMNI-TECH®, OMNI-SHADE®, OMNI-SHIELD™, OMNI-DRY®, OMNI-GRIP®, TECHLITE®, GRT®, PFG®, PHG®, Columbia Interchange System®, Titanium®, Sorel®, Mountain Hard Wear®, Montrail® , Pacific Trail®, the Columbia diamond shaped logo and arrow-circle design, the Mountain Hardwear nut logo and the Sorel polar bear logo. Our trademarks, many of which are registered or subject to pending applications in the United States and other nations, are used on virtually all of our products. We believe that our trademarks are an important factor in creating a market for our products, in identifying the Company, and in differentiating our products from competitors’ products. We vigorously protect these proprietary rights against counterfeit reproductions or other infringing activities.
Sales and Distribution
We sell our products through a mix of wholesale distribution channels, independent distributors, our own retail stores and licensees. Wholesale distribution channels include small, independently operated specialty stores, regional and national sporting goods chains, and large regional and national department store chains. We sell our products directly to consumers through a growing network of our own branded and outlet retail stores, and plan to begin selling our products to U.S. consumers on-line in the summer of 2009 through a new company-owned e-commerce website currently under development. In addition to our own retail operation, independent distributors, franchisees and licensees operate a total of over 400 Columbia and Mountain Hardwear-branded and outlet retail stores in various locations.
The following table presents net sales to unrelated entities and approximate percentages of net sales by geographic segment for each of the last three years (dollars in millions):
| 2008 | 2007 | 2006 | ||||||||||||||||
| Net Sales | % of Sales | Net Sales | % of Sales | Net Sales | % of Sales | |||||||||||||
| United States |
$ | 727.7 | 55.2 | % | $ | 767.2 | 56.6 | % | $ | 752.0 | 58.4 | % | ||||||
| Europe, Middle East and Africa (“EMEA”) |
267.2 | 20.3 | 287.0 | 21.1 | 272.6 | 21.2 | ||||||||||||
| Latin America and Asia Pacific (“LAAP”) |
198.2 | 15.0 | 175.7 | 13.0 | 142.9 | 11.1 | ||||||||||||
| Canada |
124.7 | 9.5 | 126.1 | 9.3 | 120.2 | 9.3 | ||||||||||||
| Total |
$ | 1,317.8 | 100.0 | % | $ | 1,356.0 | 100.0 | % | $ | 1,287.7 | 100.0 | % | ||||||
See Note 15 of Notes to Consolidated Financial Statements for net sales to unrelated entities, income before income tax, interest income (expense), income tax expense, depreciation and amortization expense, goodwill and identifiable assets by geographic segment.
United States and Canada
We sell our products in the United States and Canada to wholesale customers, through our own retail stores, and through licensees. Approximately 49% of the wholesale customers that offer our products worldwide are located in the United States and Canada. As of December 31, 2008, we operated 29 outlet retail stores and 8 branded retail stores in various locations throughout North America. In 2008, we licensed our Columbia, Sorel and Pacific Trail trademarks through 18 licensees in the United States. Sales in these two countries accounted for 64.7% of our net sales for 2008.
5
We distribute the majority of our products sold to United States wholesale customers and our own retail stores from distribution centers in Portland, Oregon and Robards, Kentucky. We own and operate both of these facilities. We distribute the majority of our products in Canada through two distribution centers in Strathroy, Ontario. We lease one of these facilities and completed construction of our owned facility in June 2008. In some instances, we arrange to have products shipped directly from our independent manufacturers to customer-designated facilities in the United States and Canada.
EMEA
We sell our products in our EMEA segment to wholesale customers, independent distributors, and through our own retail stores. Approximately 48% of the wholesale customers that offer our products worldwide are located in Western Europe. Approximately 62% of independent distributors that offer our products worldwide are located in our EMEA segment. As of December 31, 2008, we operated three outlet retail stores in Europe: one each in France, Spain and the United Kingdom. Sales in our EMEA region accounted for 20.3% of our net sales for 2008.
We distribute our apparel and footwear products in direct markets in Europe through our distribution center in Cambrai, France, that we own and operate. Independent distributors in our EMEA region serve wholesale and retail customers in several locations throughout the EMEA region, including Russia, portions of Europe, the Middle East and Africa. The majority of sales to our EMEA distributors are factory-direct shipments.
LAAP
We sell our products in our LAAP segment to independent distributors, through our own retail stores, to franchisees, to licensees and to wholesale customers. Approximately 38% of independent distributors that offer our products worldwide are located in our LAAP segment. As of December 31, 2008, we operated 59 branded retail stores and 18 outlet retail stores in Japan and Korea within our LAAP region. Approximately 3% of the wholesale customers that offer our products worldwide are located in Japan and Korea. Sales in our LAAP region accounted for 15.0% of our net sales for 2008.
Independent distributors in our LAAP region serve wholesale and retail customers in several locations throughout the LAAP region, including Australia, New Zealand, Latin America, and Asia. The vast majority of sales to our LAAP distributors are factory-direct shipments. We distribute our products in Japan through an independent logistics company that owns and operates a warehouse located near Tokyo, Japan. We distribute our products in Korea from a leased warehouse near Seoul, Korea.
Advertising, Marketing, and Promotion
Advertising, marketing and promotional programs are integral parts of our global strategy to build brand equity, raise global brand awareness, infuse our brands with excitement and stimulate consumer demand for our products worldwide. Our advertising, marketing and promotional efforts consist of integrated marketing activities, including print, television, outdoor and Internet advertising; enhanced in-store displays and merchandising techniques executed in partnership with various wholesale customers; public relations and brand communications focused on our innovative apparel, footwear, accessories and equipment technologies, performance features and styling. Our key brand messages are reinforced consistently at our wholesale customers’ stores using concept shops, focus areas and other visual merchandising displays dedicated exclusively to selling our merchandise on a year-round basis.
We also reinforce our marketing and product innovation messages through selected sponsorships of individual outdoor athletes, personalities and teams who serve as inspirational models of excellence to consumers. In 2008 we debuted a new 3-year sponsorship of the Team Columbia-Highroad professional cycling team at the 2008 Tour de France. Team Columbia-Highroad finished 2008 as the number one cycling team in the world with more stage victories over the course of the professional cycling season than any other team. The
6
team’s success has continued to generate substantial media attention and generate favorable visibility for the Columbia brand in key markets around the world, especially in Europe, Australia and Latin American markets where professional cycling is among the most popular spectator and participant sports.
Working Capital Utilization
We design, develop, market and distribute our products, but do not own or operate our own manufacturing facilities. As a result, most of our capital is invested in short-term working capital assets, including cash and cash equivalents, short term investments, accounts receivable from customers, and finished goods inventory. At December 31, 2008, working capital assets accounted for approximately 76% of total assets. As a result, the degree to which we efficiently utilize our working capital assets can have a significant impact on our profitability and return on invested capital. The overall goals of our working capital management efforts are to maintain the minimum level of inventory necessary to deliver goods on time to our customers to satisfy end consumer demand, and to minimize the cycle time from the purchase of inventory from our suppliers to the collection of accounts receivable balances from our customers.
Demand Planning and Inventory Management
As a branded consumer products company, inventory represents one of the largest and riskiest capital commitments in our business model. We design and develop our seasonal product lines twelve to eighteen months in advance of their availability to consumers in retail stores. As a result, our ability to estimate seasonal consumer demand and to purchase appropriate levels of finished goods from our suppliers can significantly affect our sales, gross margins and profitability. For this reason, we maintain and continue to make substantial investments in information systems, processes and personnel in support of our ongoing demand planning efforts. The goals of our demand planning efforts are to purchase an adequate amount of inventory to service a targeted percentage of total consumer demand while minimizing excess inventory to avoid the negative effect that liquidating excess, end-of-season goods at discounted prices has on our gross margins and profitability.
In order to manage inventory risk, we use incentive discounts to encourage our wholesale customers to place advance orders approximately four to six months in advance of scheduled delivery. We use those advance orders, together with forecasted demand from our own retail stores, market trends, historical data, customer and sales feedback and several other important factors, to determine the volumes of each product to purchase from our suppliers around the world. From the time of initial order through production, receipt and delivery, we attempt to manage our inventory to reduce risk.
Our inventory management efforts cannot entirely eliminate inventory risk due to the inherently unpredictable nature of consumer demand, the ability of customers to cancel their orders prior to shipment, and other variables that affect our customers’ ability to take delivery of their orders when originally scheduled. In addition, we build calculated amounts of speculative inventory to support estimated at-once orders from customers and auto-replenishment orders on certain long-lived styles.
Credit and Collection
We extend credit to our customers based on an assessment of the customer’s financial condition, generally without requiring collateral. To assist us in scheduling production with our suppliers and delivering seasonal products to our customers on time, we offer customers discounts for placing advance orders and extended payment terms for taking delivery before the peak shipping season. These extended payment terms increase our exposure to the risk of uncollectible receivables. In order to manage the inherent risks of customer receivables, we maintain and continue to invest in information systems, processes and personnel skilled in credit and collections. In some markets and with some customers we use credit insurance or standby letters of credit to minimize our risk of credit loss.
7
Sourcing and Manufacturing
Virtually all of our products are produced to our specifications by independent manufacturers located outside the United States. We believe that the use of independent manufacturers enables us to substantially limit our capital expenditures and avoid the costs and risks associated with owning and operating large production facilities and managing large labor forces. We also believe that the use of independent manufacturers greatly increases our production capacity, maximizes our flexibility and improves our product pricing. We generally do not maintain long-term manufacturing contracts; however, we believe that our historical long-term relationships with various manufacturers will help to ensure that adequate sources are available to produce a sufficient supply of goods in a timely manner and on satisfactory economic terms in the future. Our four largest factory groups accounted for approximately 11% of our total global apparel production in 2008 and a single vendor supplies substantially all of the zippers used in our products. These companies, however, have multiple factory locations, many of which are in different countries, thus reducing the risk that unfavorable conditions at a single factory or location will have a material adverse effect on our business.
Our apparel is manufactured in more than fifteen countries with Vietnam and China accounting for approximately 67% of our 2008 apparel production. Our footwear is manufactured in three countries with China and Vietnam accounting for approximately 99% of our 2008 footwear production.
We maintain thirteen manufacturing liaison offices in a total of seven Asian countries. Personnel in these manufacturing liaison offices are direct employees of Columbia, and are responsible for overseeing production at our independent manufacturers. We believe that having employees physically located in these regions enhances our ability to monitor factories for compliance with our policies, procedures and standards related to quality, delivery, pricing and labor practices. Our quality assurance process is designed to ensure that our products meet the highest quality standards. We believe that our quality assurance process is an important and effective means of maintaining the quality and reputation of our products.
Backlog
We typically receive the majority of our advance orders from our wholesale customers for the fall and spring seasons by March 31 and September 30, respectively, based upon customer ordering deadlines that we establish. As a result, our order backlog at March 31 and September 30 has historically been a meaningful indicator of anticipated sales for the corresponding future period. Accordingly, we disclose our backlog at March 31 and at September 30 in our Quarterly Reports on Form 10-Q for those respective periods, rather than at December 31. Generally, orders are subject to cancellation prior to the date of shipment.
Our owned retail stores do not participate in the advance order program, nor will our e-commerce business scheduled for launch in the summer of 2009. Accordingly, to the extent that order cancellations from wholesale customers remain at elevated levels and our retail and e-commerce sales grow to represent a larger proportion of our total sales, our advance order backlog may become less indicative of anticipated sales for the corresponding future periods.
Competition
The markets for sportswear, outerwear, footwear, and related accessories and equipment are highly competitive. In each of our geographic markets, we face significant competition from numerous and varying competitors. Some of our large wholesale customers also pose a significant competitive threat by marketing apparel, footwear and equipment under their own private labels. Our licensees operate in very competitive markets, such as those for watches, leather outerwear and socks. In addition, our retail expansion initiative is exposing us to a new set of competitors who operate retail stores in outlet malls and key metropolitan markets. We believe that the primary competitive factors in the market for active sportswear, outerwear, footwear and related accessories and equipment are brand strength, product innovation, product design and functionality, durability and price.
8
Government Regulation
Many of our imports are subject to existing or potential governmental tariff and non-tariff barriers to trade, such as import duties and potential safeguard measures that may limit the quantity of various types of goods that may be imported into the United States and other countries. These trade barriers often represent a material portion of the cost of the merchandise. Our products are also subject to domestic and foreign product safety and environmental standards, laws and other regulations, which are increasingly restrictive and complex. Although we diligently monitor these standards and restrictions, the United States or other countries may impose new or adjusted quotas, duties, safety requirements, material restrictions, or other restrictions or regulations, any of which may have a material adverse effect on our results of operations and financial condition.
Employees
At December 31, 2008 we had the equivalent of 3,163 full-time employees. Of these employees, 1,737 were based in the United States, 985 in Asia, 320 in Europe and 121 in Canada.
Available Information
We file with the Securities and Exchange Commission (“SEC”) our annual report on Form 10-K, quarterly reports on Form 10-Q, current reports on Form 8-K and all amendments to those reports, proxy statements and registration statements. You may read and copy any material we file with the SEC at the SEC’s Public Reference Room at 100 F Street, NE, Washington, D.C. 20549. You may also obtain information on the operation of the Public Reference Room by calling the SEC at 1-800-SEC-0330. In addition, the SEC maintains an internet site at http://www.sec.gov that contains reports, proxy and information statements, and other information regarding issuers, including us, that file electronically. We make available free of charge on or through our website at www.columbia.com our annual reports on Form 10-K, quarterly reports on Form 10-Q, current reports on Form 8-K and amendments to these reports filed or furnished pursuant to Section 13(a) or 15(d) of the Exchange Act as soon as reasonably practicable after we file these materials with the SEC.
| Item 1A. | RISK FACTORS |
In addition to the other information contained in this Form 10-K, the following risk factors should be considered carefully in evaluating our business. Our business, financial condition, or results of operations may be materially adversely affected by any of these risks. Please note that additional risks not presently known to us or that we currently deem immaterial may also impair our business and operations.
We May be Adversely Affected by a Prolonged Economic Downturn or Economic Uncertainty
We are a consumer products company and are highly dependent on consumer discretionary spending patterns. As global economic conditions deteriorate or economic uncertainty increases, trends in consumer discretionary spending also become unpredictable and subject to reductions due to uncertainties about the future. Consumer demand for our products may not reach our growth targets, or may decline, when there is an economic downturn or economic uncertainty in our key markets, particularly markets in North America and Europe. Our sensitivity to economic cycles and any related fluctuation in consumer demand may have a material adverse effect on our financial condition, results of operations or cash flows.
We May be Adversely Affected by Volatility in Global Production Costs
Our product costs are subject to substantial fluctuation based on labor markets, interest rates, global oil markets, production capacity at independent manufacturers, and general economic conditions. For example, volatility in global oil markets has resulted in fluctuating fuel and product prices and caused costs to produce our products with independent contractors to change. Because we price our products in advance and the external cost changes may be difficult to predict, we may not be able to timely adjust our pricing structure to remain
9
competitive. In addition, since the majority of our products are manufactured outside of our principal sales markets, our products must be transported by third parties over large geographical distances and this volatility can result in quickly changing transportation costs.
We May be Adversely Affected by the Financial Health of our Customers
Slowing economies and consumer uncertainty regarding future economic prospects in our key markets are having an adverse effect on the financial health of our customers, some of whom have filed or may file for protection under bankruptcy laws, which may in turn have a material adverse effect on our results of operations and financial condition. We extend credit to our customers based on an assessment of the customer’s financial condition, generally without requiring collateral. To assist in the scheduling of production and the shipping of seasonal products, we offer customers discounts for placing pre-season orders and extended payment terms for taking delivery before the peak shipping season. These extended payment terms increase our exposure to the risk of uncollectible receivables. In addition, we face increased risk of order reduction or cancellation when dealing with financially ailing retailers or retailers struggling with economic uncertainty. Some of our significant customers have had financial difficulties in the past and are currently experiencing tightened credit markets and declining sales and profitability on a comparable store basis, which in turn has an adverse effect on our business. We may reduce our level of business with customers experiencing financial difficulties and may not be able to replace that business with other customers, which could have an adverse effect on our financial position, results of operations or cash flows.
We May be Adversely Affected by Global Credit Market Conditions
Economic downturns and economic uncertainty generally affect global credit markets. Our vendors, customers and other participants in our supply chain may require access to credit markets in order to do business. Credit market conditions may slow our collection efforts as customers experience increased difficulty in obtaining requisite financing, leading to higher than normal accounts receivable. This could result in greater expense associated with collection efforts and increased bad debt expense. Credit conditions may impair our vendors’ ability to finance the purchase of raw materials or general working capital needs to support our production requirements, resulting in a delay or non-delivery of inventory shipments during key seasons.
Historically we have limited our reliance on debt to finance our working capital, capital expenditures and investing activity requirements. We expect to fund our future capital expenditures with existing cash, expected operating cash flows and credit facilities, but if the need arises for additional expenditures, we may need to seek additional funding. Our ability to obtain additional financing will depend on many factors, including prevailing market conditions, our financial condition, and our ability to negotiate favorable terms and conditions. Financing may not be available on terms that are acceptable or favorable to us, if at all.
Our Advance Purchases of Products May Result in Excess Inventories
To minimize our purchasing costs, the time necessary to fill customer orders and the risk of non-delivery, we place orders for our products with manufacturers prior to receiving all of our customers’ orders and we maintain an inventory of various products that we anticipate will be in greater demand. In addition, customers are generally allowed to cancel orders prior to shipment with sufficient notice. Particularly in light of current economic conditions, we may not be able to sell the products we have ordered from manufacturers or that we have in our inventory. Inventory levels in excess of customer demand may result in inventory write-downs and the sale of excess inventory at discounted prices through discount retail channels, which may have a material adverse effect on our brand image, our financial condition, results of operations or cash flows.
We May be Adversely Affected by Weather Conditions
Our business is adversely affected by unseasonable weather conditions. A significant portion of the sales of our sportswear, outerwear, footwear and accessories and equipment is dependent in part on the weather and may
10
decline in years in which weather conditions do not favor the use of these products. Periods of unseasonably warm weather in the fall or winter or unseasonably cold or wet weather in the spring may have a material adverse effect on our results of operations and financial condition. For example, in spring 2008, unseasonably cool weather in the United States caused customers to delay, and in some cases reduce or cancel, orders for our sportswear and footwear, which had an adverse effect on our net sales and profitability. Inventory accumulation by our wholesale customers resulting from unseasonable weather in one season may negatively affect orders in future seasons, which may have a material adverse effect on our results of operations and financial condition in future periods.
Our International Operations Involve Many Risks
We are subject to the risks generally associated with doing business abroad. These risks include foreign laws and regulations, foreign consumer preferences, political unrest, terrorist acts, military operations, disruptions or delays in shipments, disease outbreaks and changes in economic conditions in countries in which we manufacture or sell products. These factors, among others, may affect our ability to sell products in international markets, our ability to manufacture products or procure materials, and our cost of doing business. If any of these or other factors make the conduct of business in a particular country undesirable or impractical, our business may be materially and adversely affected. As we expand our operations in geographic scope and product categories, we anticipate intellectual property disputes will increase as well, making it more expensive and challenging to establish and protect our proprietary rights and to defend against claims of infringement by others.
As a global company, we determine our income tax liability in various competing tax jurisdictions based on a careful analysis and interpretation of local tax laws and regulations. This analysis requires a significant amount of judgment and estimation and is often based on various assumptions about the future actions of the local tax authorities. These determinations are the subject of periodic domestic and foreign tax audits. Although we accrue for uncertain tax positions, our accrual may be insufficient to satisfy unfavorable findings, which by their nature cannot be predicted with certainty. Unfavorable audit findings and tax rulings may result in payment of taxes, fines and penalties for prior periods and higher tax rates in future periods, which may have a material adverse effect on our results of operations and financial condition.
In addition, many of our imported products are subject to duties, tariffs or quotas that affect the cost and quantity of various types of goods imported into the United States or into our other sales markets. Any country in which our products are produced or sold may eliminate, adjust or impose new quotas, duties, tariffs, anti-dumping penalties or other charges or restrictions, any of which may have a material adverse effect on our results of operations and financial condition.
We Operate in Very Competitive Markets
The markets for sportswear, outerwear, footwear, related accessories and equipment are highly competitive, as are the markets for our licensed products. In each of our geographic markets, we face significant competition from global and regional branded apparel, footwear, accessories and equipment companies.
Retailers who are our customers often pose our most significant competitive threat by marketing apparel, footwear and equipment under their own labels. For example, in the United States, several of our largest customers have developed significant private label brands during the past decade that compete directly with our products. These retailers have assumed an increasing degree of inventory risk in their private label products and, as a result, may first cancel advanced orders with us in order to manage their own inventory levels downward during a weak economic cycle.
We also compete with other companies for the production capacity of independent manufacturers that produce our products and for import quota capacity. Many of our competitors are significantly larger than us, have substantially greater financial, distribution, marketing and other resources than we have, and have achieved
11
greater recognition for their products than we have. Increased competition may result in reductions in display areas in retail locations, reductions in sales, or reductions in our profit margins, any of which may have a material adverse effect on our results of operations and financial condition.
We May be Adversely Affected by Retailer Consolidation
When our wholesale customers combine their operations through mergers, acquisitions, or other transactions, their consolidated order volume may decrease while their bargaining power and the competitive threat they pose by marketing products under their own label may increase. Some of our significant customers have consolidated their operations in the past, which in turn has had a negative effect on our business. As many retailers face increased financial pressure from significant decreases in consumer spending and continued economic uncertainty, we expect retailer consolidation to continue, which may have a material adverse effect on our results of operations and financial condition.
We Face Risks Associated with Consumer Preferences and Fashion Trends
Changes in consumer preferences or consumer interest in outdoor activities may have a material adverse effect on our business. In addition, changes in fashion trends may have a greater impact than in the past as we expand our offerings to include more product categories in more geographic areas. We also face risks because our business requires us to anticipate consumer preferences. Our decisions about product designs often are made far in advance of consumer acceptance. Although we try to manage our inventory risk through early order commitments by retailers, we must generally place production orders with manufacturers before we have received all of a season’s orders, and orders may be cancelled by customers before shipment. If we fail to anticipate and respond to consumer preferences, we may have lower sales, excess inventories and lower profit margins, any of which may have a material adverse effect on our results of operations and financial condition.
Our Success Depends on Our Use of Proprietary Rights
Our registered and common law trademarks have significant value and are important to our ability to create and sustain demand for our products. We also place significant value on our trade dress, the overall appearance and image of our products. From time to time, we discover products that are counterfeit reproductions of our products or that otherwise infringe on our proprietary rights. Counterfeiting activities typically increase as brand recognition increases, especially in markets outside the United States. Increased instances of counterfeit manufacture and sales of these products may adversely affect our sales and our brand and result in a shift of consumer preference away from our products. The actions we take to establish and protect trademarks and other proprietary rights may not be adequate to prevent imitation of our products by others or to prevent others from seeking to block sales of our products as violations of proprietary rights. In markets outside of the United States, it may be more difficult for us to establish our proprietary rights and to successfully challenge use of those rights by other parties. We also license our proprietary rights to third parties. Failure to choose appropriate licensees and licensed product categories may dilute or harm our brand image. Actions or decisions in the management of our intellectual property portfolio may affect the strength of the brand, which may in turn have a material adverse effect on our results of operations and financial condition.
Although we have not been materially inhibited from selling products in connection with trademark and trade dress disputes, as we extend our brand into new product categories and new product lines and expand the geographic scope of our marketing, we may become subject to litigation based on allegations of the infringement of intellectual property rights of third parties including third party trademark, copyright and patent rights. Future litigation also may be necessary to defend us against such claims or to enforce and protect our intellectual property rights. Any intellectual property litigation may be costly and may divert management’s attention from the operation of our business. Adverse determinations in any litigation may result in the loss of our proprietary rights, subject us to significant liabilities or require us to seek licenses from third parties, which may not be available on commercially reasonable terms, if at all. This may have a material adverse effect on our results of operations and financial condition.
12
Our Success Depends on Our Distribution Facilities
Our ability to meet customer expectations, manage inventory, complete sales and achieve objectives for operating efficiencies depends on the proper operation of our existing distribution facilities, the development or expansion of additional distribution capabilities and the timely performance of services by third parties (including those involved in shipping product to and from our distribution facilities). In the United States, we rely primarily on our distribution centers in Portland, Oregon and Robards, Kentucky; in Canada, we rely primarily on our distribution facilities in Strathroy, Ontario; and in Europe we rely primarily on our distribution center in Cambrai, France.
Our distribution facilities in the United States and France are highly automated, which means that their operations are complicated and may be subject to a number of risks related to computer viruses, the proper operation of software and hardware, electronic or power interruptions, and other system failures. Risks associated with upgrading or expanding these facilities may significantly disrupt or increase the cost of our operations.
Our distribution facilities may also be interrupted by disasters, such as earthquakes (which are known to occur in the Northwestern United States) or fires. We maintain business interruption insurance, but it may not adequately protect us from the adverse effect that may be caused by significant disruptions in our distribution facilities.
Our Success Depends on Our Information Systems
Our business is increasingly reliant on information technology. Information systems are used across our supply chain and retail operations, from design to distribution and sales, and are used as a method of communication between employees, with our subsidiaries and liaison offices overseas, as well as with our customers and retail stores. We also rely on our information systems to allocate resources and forecast operating results. System failures, breach of confidential information, or service interruptions may occur as the result of a number of factors, including computer viruses, hacking or other unlawful activities by third parties, disasters, or our failure to properly protect, repair, maintain, or upgrade our systems. Any breach or interruption of critical business information systems may have a material adverse effect on our results of operations and financial condition.
Our Success Depends on Our Business Strategies
Our business strategies are to achieve sustainable, profitable growth by creating innovative products, elevating consumer perception of our brands, increasing consumer and retailer awareness and demand for our products, creating compelling retail environments, and building stronger emotional brand connections with consumers over time. We intend to pursue these strategies across extended product categories and in a growing number of geographic markets. We face many challenges in implementing our growth strategies. For example, expansion of our direct-to-consumer business will require significant investments, yet, in the current macroeconomic environment of increased economic uncertainty and declining consumer demand, may not have the desired effect of increasing demand for our products. Our ability to expand our global footwear business and European business may also be significantly limited as a result of global economic conditions and a general decline in global consumer demand. The success of our retail initiative depends on our ability to adapt our internal processes to facilitate direct-to-consumer sales, to effectively manage retail store inventory, to hire, retain and train personnel capable of managing a retail operation, to identify and negotiate favorable terms for retail locations, and to effectively manage construction, opening, and ongoing operations of stores globally. The failure to implement our growth strategies may have a material adverse effect on our business.
Our growth strategies and related increased expenditures could also cause our operating margin to decline if we are unable to offset our increased spending with increased sales or comparable reductions in other operating costs. If our sales decline or fail to grow as planned and we fail to sufficiently reduce our operating expenses, our profitability will decline. This could result in our decision to delay, reduce, modify or terminate our strategic growth initiatives, which could have a material adverse effect on our financial condition, results of operations or cash flows.
13
We continue to expand into international markets where we have little sales or distribution experience and where our brands are not yet widely known. Expanding our product categories involves, among other things, gaining experience with new brands and products, gaining consumer acceptance, and establishing and protecting intellectual property rights. Attracting superior retail channel partners and improving the sales productivity of our customers each depend on various factors, including the strength of our brand names, our ability to design and manufacture innovative products, competitive conditions, the availability of desirable locations and the negotiation of terms with customers. Future terms with customers may be less favorable to us than those under which we now operate. Large wholesale customers in particular increasingly seek to transfer various costs of business to their vendors, such as the cost of lost profits from promotional activity and product price markdowns, which could cause our gross margin to decline if we are unable to offset price reductions with comparable reductions in operating costs.
To implement our business strategy, we must continue to modify various aspects of our business, to maintain and enhance our information systems and operations to respond to increased demand and to attract, retain and manage qualified personnel. Changes in our business may place an increasing strain on management, financial, product design, marketing, distribution and other resources, and we may have operating difficulties as a result. For example, our new strategic initiatives, including the implementation of our retail store strategy, require significant management attention and corporate resources. These growth initiatives involve many risks and uncertainties that, if not managed effectively, may have a material adverse effect on our financial condition, results of operations or cash flows.
We May be Adversely Affected by Currency Exchange Rate Fluctuations
Although the majority of our product purchases are denominated in U.S. dollars, the cost of these products may be affected by the relative changes in the value of the local currency of the manufacturer. Price increases caused by currency exchange rate fluctuations may make our products less competitive or have an adverse effect on our margins. Our international revenues and expenses generally are derived from sales and operations in currencies other than the U.S. dollar. Because the primary currency of many of our subsidiaries is not the U.S. dollar, we are exposed to potential material gains or losses from the remeasurement of monetary transactions into the U.S. dollar. Currency exchange rate fluctuations may also disrupt the business of the independent manufacturers that produce our products by making their purchases of raw materials more expensive and more difficult to finance. As a result, currency fluctuations may have a material adverse effect on our results of operations and financial condition.
Our Investments May be Adversely Affected by an Economic Downturn or Economic Uncertainty
Our investment portfolio is subject to a number of risks and uncertainties. Changes in market conditions, such as those that accompany an economic downturn or economic uncertainty, may negatively affect the value and liquidity of our investment portfolio, perhaps significantly. Our ability to find diversified investments that are both safe and liquid and that provide a reasonable return may be impaired. This could result in lower interest income, less diversification, longer investment maturities and/or higher other-than-temporary impairments.
We May be Adversely Affected by Labor Disruptions
Our business depends on our ability to source and distribute products in a timely manner. Labor disputes at factories, shipping ports, transportation carriers, retail stores or distribution centers create significant risks for our business, particularly if these disputes result in work slowdowns, lockouts, strikes, or other disruptions during our peak manufacturing and importing seasons, and may have a material adverse effect on our business, potentially resulting in cancelled orders by customers, unanticipated inventory accumulation, and reduced revenues and earnings.
We Depend on Independent Manufacturers
Our products are produced by independent manufacturers worldwide. We do not operate or own any production facilities. Although we enter into a number of purchase order commitments each season, we generally
14
do not maintain long-term manufacturing contracts. Because of these factors, manufacturing operations may fail to perform as expected or our competitors may obtain production or quota capacities that effectively limit or eliminate the availability of these resources to us. If a manufacturer fails to ship orders in a timely manner or to meet our standards or if we are unable to obtain necessary production or quota capacities, we may miss delivery deadlines, or incur additional costs, which may result in cancellation of orders, refusal to accept deliveries, a reduction in purchase prices, or increased costs, any of which may have a material adverse effect on our business. Reliance on independent manufacturers also creates quality control risks. A failure in our quality control program may result in diminished product quality, which may result in increased order cancellations and returns, decreased consumer demand for our products, or product recalls, any of which may have a material adverse effect on our results of operations and financial condition. Finally, if a manufacturer violates labor or other laws, or engages in practices that are not generally accepted as ethical in our key markets, we may be subject to significant negative publicity, consumer demand for our products may decrease, and under some circumstances we may be subject to liability for the manufacturer’s practices, any of which may have a material adverse effect on our results of operations and financial condition.
We Depend on Key Suppliers
Some of the materials that we use may be available from only one source or a very limited number of sources. For example, some specialty fabrics are manufactured to our specification by one source or a few sources and zippers are supplied by one manufacturer. From time to time, we have difficulty satisfying our raw material and finished goods requirements. Although we believe that we can identify and qualify additional manufacturers to produce these materials as necessary, there are no guarantees that additional manufacturers will be available. In addition, depending on the timing, any changes may result in increased costs or production delays, which may have a material adverse effect on our results of operations and financial condition.
We Depend on Key Personnel
Our future success will depend in part on the continued service of key personnel, particularly Timothy Boyle, our President and Chief Executive Officer, and Gertrude Boyle, our Chairman and widely-recognized advertising icon. Our future success will also depend on our ability to attract and retain key managers, designers, sales people and others. We face intense competition for these individuals worldwide, and there is a significant concentration of well-funded apparel and footwear competitors in and around Portland, Oregon. We may not be able to attract qualified new employees or retain existing employees, which may have a material adverse effect on our results of operations and financial condition.
Our Business Is Affected by Seasonality
Our business is affected by the general seasonal trends common to the outdoor apparel industry. Our products are marketed on a seasonal basis and our product mix is weighted substantially toward the fall season, resulting in sales and profits being highest in the third calendar quarter. This seasonality, along with other factors that are beyond our control and that are discussed elsewhere in this section, may adversely affect our business and cause our results of operations to fluctuate. Our operating margins are also sensitive to a number of factors that are beyond our control, including shifts in product sales mix, geographic sales trends, and currency exchange rate fluctuations, all of which we expect to continue as we expand our product offerings and geographic sales. Results of operations in any period should not be considered indicative of the results to be expected for any future period.
Our Products Are Subject to Increasing Product Regulations and We Face Risks of Product Liability and Warranty Claims
Our products are subject to increasingly stringent and complex domestic and foreign product performance and safety standards, laws and other regulations. These requirements could result in greater expense associated
15
with compliance efforts and failure to comply with such regulations could result in a delay, non-delivery or mandated destruction of inventory shipments during key seasons or in other financial penalties. Significant or continuing noncompliance with such standards and laws could harm our reputation and, as a result, could have an adverse effect on our sales and financial condition.
Our products are used in outdoor activities, sometimes in severe conditions. Product recalls or product liability claims in the future, resulting from the alleged failure of our products, could have a material adverse effect on our results of operations and financial condition. Some of our products carry warranties for defects in quality and workmanship. We maintain a warranty reserve for future warranty claims, but the actual costs of servicing future warranty claims may exceed the reserve, which may also have a material adverse effect on our results of operations and financial condition.
Our Common Stock Price May Be Volatile
The price of our common stock has fluctuated substantially since our initial public offering. Our common stock is traded on the NASDAQ Global Select Market, which is likely to continue to have significant price and volume fluctuations that may adversely affect the market price of our common stock without regard to our operating performance. Factors such as general market conditions, fluctuations in financial results, variances from financial market expectations, changes in earnings estimates by analysts, or announcements by us or our competitors may also cause the market price of our common stock to fluctuate, perhaps substantially.
Insiders Control a Majority of Our Common Stock and May Sell Shares
Three shareholders—Timothy Boyle, Gertrude Boyle and Sarah Bany—beneficially own a majority of our common stock. As a result, if acting together, they can effectively control matters requiring shareholder approval without the cooperation of other shareholders. Shares held by these three insiders are available for resale, subject to the requirements of, and the rules under, the Securities Act of 1933 and the Securities Exchange Act of 1934. The sale or the prospect of the sale of a substantial number of these shares may have an adverse effect on the market price of our common stock.
| Item 1B. | UNRESOLVED STAFF COMMENTS |
None.
| Item 2. | PROPERTIES |
Following is a summary of principal properties owned or leased by us.
| Corporate Headquarters: |
Europe Headquarters (2): | |
| Portland, Oregon (1 location)—owned |
Geneva, Switzerland (1 location)—leased | |
| U.S. Distribution Facilities: |
Europe Administrative Operation: | |
| Portland, Oregon (1 location)—owned |
Strasbourg, France (1 location)—owned | |
| Robards, Kentucky (1 location)—owned |
Europe Distribution Facility: | |
| Canadian Operation and Distribution Facilities (1): |
Cambrai, France (1 location)—owned | |
| Strathroy, Ontario (2 locations)—1 owned, 1 leased |
| (1) | Lease expires in December 2011. |
| (2) |
Lease expires in June 2010. |
In addition, as of December 31, 2008, we leased over 100 locations globally for the operation of our branded and outlet retail stores. We also have several leases globally for office space, warehouse facilities, storage space, vehicles and equipment, among other things. See Note 11 of Notes to Consolidated Financial Statements for further lease-related disclosures.
16
| Item 3. | LEGAL PROCEEDINGS |
From time to time in our normal course of business we are a party to various legal claims, actions and complaints. Currently, we do not have any pending litigation that we consider material.
| Item 4. | SUBMISSION OF MATTERS TO A VOTE OF SECURITY HOLDERS |
None.
| Item 4A. | EXECUTIVE OFFICERS AND KEY EMPLOYEES OF THE REGISTRANT |
The following table sets forth our executive officers and certain key employees. All information is as of the date of the filing of this report.
| Name |
Age |
Position | ||
| Gertrude Boyle |
84 | Chairman of the Board (1) | ||
| Timothy P. Boyle |
59 | President, Chief Executive Officer, Director (1) | ||
| Kerry W. Barnes |
58 | Vice President of Retail | ||
| Timothy C. Bartels |
44 | Vice President of Global Footwear Sales | ||
| Peter J. Bragdon |
46 | Vice President and General Counsel, Secretary (1) | ||
| Thomas B. Cusick |
41 | Vice President, Chief Financial Officer and Treasurer (1) | ||
| Mitchell C. Fields |
61 | Vice President of Global Apparel Sales | ||
| Daniel G. Hanson |
50 | Vice President of Marketing | ||
| Mark N. Koppes |
46 | Vice President of U.S. Apparel | ||
| Michael W. McCormick |
46 | Executive Vice President of Global Sales and Marketing (1) | ||
| Mark J. Nenow |
51 | Vice President of Global Footwear Merchandising | ||
| Susan G. Popp |
53 | Vice President of Global Human Resources (1) | ||
| Mark J. Sandquist |
49 | Vice President of Global Apparel Merchandising and ACE (1) | ||
| Bryan L. Timm |
45 | Executive Vice President and Chief Operating Officer (1) | ||
| William Tung |
44 | Vice President of Latin America and Asia Pacific (1) | ||
| Patrick J. Werner |
53 | Vice President of Global Apparel Manufacturing |
| (1) | These individuals are considered Executive Officers of Columbia. |
Gertrude Boyle has served as Chairman of the Board of Directors since 1983. Columbia was founded by her parents in 1938 and managed by her husband, Neal Boyle, from 1964 until his death in 1970. Mrs. Boyle also served as our President from 1970 to 1988. Mrs. Boyle is Timothy P. Boyle’s mother.
Timothy P. Boyle joined Columbia in 1971 as General Manager and has served as President and Chief Executive Officer since 1988. He has been a member of the Board of Directors since 1978. Mr. Boyle is also a member of the Board of Directors of Northwest Natural Gas Company and Craft Brewers Alliance, Inc. Mr. Boyle is Gertrude Boyle’s son.
Kerry W. Barnes joined Columbia in January 2007 as Vice President of Retail. From 2001 to 2006, Mr. Barnes served as the Director of Retail Stores for adidas AG. From 1981 to 2001, Mr. Barnes held various retail positions at Foot Locker, Inc. including Director of Outlet Stores and Regional Vice President of the West Coast.
Timothy C. Bartels joined Columbia in July 2008 as Vice President of Global Footwear Sales. Mr. Bartels served as Vice President of Global Sales for Keen Footwear from 2006 to 2008 and Vice President of Sales for DC Shoes, Inc. (a division of Quiksilver, Inc.) from 2002 to 2006. From 1987 to 2002, Mr. Bartels held a variety of sales management and sales leadership roles at NIKE, Inc.
17
Peter J. Bragdon became Vice President and General Counsel, Secretary of Columbia in July 2004. From 1999 to January 2003, Mr. Bragdon served as Senior Counsel and Director of Intellectual Property for Columbia. Mr. Bragdon served as Chief of Staff in the Oregon Governor’s office from January 2003 through June 2004. From 1993 to 1999, Mr. Bragdon was an attorney in the corporate securities and finance group at Stoel Rives LLP. Mr. Bragdon served as Special Assistant Attorney General for the Oregon Department of Justice for seven months in 1996.
Thomas B. Cusick joined Columbia in September 2002 as Corporate Controller, was named Vice President and Corporate Controller in March 2006, was named Vice President and Chief Accounting Officer in May 2008, and was named Vice President, Chief Financial Officer and Treasurer in January 2009. From 1995 to 2002, Mr. Cusick worked for Cadence Design Systems (and OrCAD, a company acquired by Cadence in 1999), which operates in the electronic design automation industry, in various financial management positions. From 1990 to 1995, Mr. Cusick was an accountant with KPMG LLP.
Mitchell C. Fields joined Columbia in October 2006 as National Sales Manager of Men’s Apparel and was named Vice President of Global Apparel Sales in June 2008. From 2002 to 2006, Mr. Fields served as Director of Sales for Callaway Golf Footwear. From 1984 to 2001, Mr. Fields held various sales management positions at NIKE, Inc. including Director of Sales for Nike Golf and Director of Replenishment.
Daniel G. Hanson joined Columbia in September 1989 and held various management positions in sales and marketing until 1996, when he became Director of Marketing Communications. In March 2006 Mr. Hanson was named Vice President of Marketing. From 1982 to 1989 Mr. Hanson worked for Helly-Hansen, where he served as United States Marketing Manager from 1986 to 1989.
Mark N. Koppes joined Columbia in August 2005 as General Manager, Men’s Apparel, was named Vice President of Men’s Apparel in November 2006 and was named Vice President of U.S. Apparel in July 2008. Prior to joining Columbia, Mr. Koppes worked at NIKE, Inc. for 15 years in various positions including Product Line Manager, Apparel Merchandise Manager, Marketing Director, Apparel Business Director, Global Merchandise Director and Men’s Apparel General Manager.
Michael W. McCormick joined Columbia in August 2006 as Vice President of Sales and was named Executive Vice President of Global Sales and Marketing in October 2008. From 2003 to 2006, Mr. McCormick served as Chief Marketing Officer for Golf Galaxy, Inc. From 2000 to 2002, Mr. McCormick served as Executive Vice President—Global Sales for Callaway Golf Company, and from 1992 to 2000, Mr. McCormick worked for NIKE, Inc. in various sales management positions, including Director of National Sales.
Mark J. Nenow joined Columbia in May 2007 as Vice President of Global Footwear Merchandising. From 2006 to 2007, Mr. Nenow served as Vice President of Global Footwear Merchandising at Brooks Sports. From 1995 to 2006, Mr. Nenow worked for NIKE, Inc. where he held various product line management positions in the running and outdoor categories. Prior to his footwear career, Mr. Nenow was a professional track and field athlete and held the American track record for the 10,000 meters from 1986 to 2003.
Susan G. Popp joined Columbia in April 1997 as Human Resources Manager and was named Human Resources Director in May 2004. In March 2006, Ms. Popp was named Vice President of Global Human Resources. Prior to joining Columbia, Ms. Popp held Human Resource positions at NIKE, Inc. from 1996 to 1997; at Avia from 1994 to 1996; and at Blue Cross and Blue Shield of Oregon from 1981 to 1993.
Mark J. Sandquist joined Columbia in March 1995 as Senior Merchandiser of Men’s and Women’s Sportswear and in August 2000 was named General Manager—Sportswear Merchandising. In July 2004, Mr. Sandquist was named Vice President of Global Apparel Merchandising and Accessories, Collegiate and Equipment (ACE). From 1985 to 1995, Mr. Sandquist held various management positions for Unionbay Sportswear.
18
Bryan L. Timm joined Columbia in June 1997 as Corporate Controller and was named Chief Financial Officer in July 2002. In 2003 Mr. Timm was named Vice President, Chief Financial Officer and Treasurer and in October 2008 he was named Executive Vice President and Chief Operating Officer and continued to serve in the role of Chief Financial Officer until January 2009. From 1991 to 1997 Mr. Timm held various financial management positions for Oregon Steel Mills, Inc. From 1986 to 1991, Mr. Timm was an accountant with KPMG LLP. Mr. Timm is a member of the Board of Directors of Umpqua Holdings Corporation.
William Tung joined Columbia in September 2003 and was named Vice President of International Sales and Operations in December 2004. In October 2008, he was named Vice President of Latin America and Asia Pacific. From 2002 to 2003, Mr. Tung worked for The Body Shop International PLC as Regional Director of North Asia. He was employed by The Rockport Company from 1994 to 2002 where he served in a variety of capacities, most recently as Vice President of Europe. From 1991 to 1994, Mr. Tung worked for Prince Racquet Sports (a division of Benetton Sportsystems) as Sales and Marketing Manager of Asia-Pacific.
Patrick J. Werner joined Columbia in April 2004 as the Director of Apparel Sportswear Sourcing and was named Vice President of Global Apparel Manufacturing in November 2006. Prior to Columbia, Mr. Werner held several key apparel sourcing manufacturing compliance roles at NIKE, Inc., where he worked from 1981 until 2004.
19
PART II
| Item 5. | MARKET FOR REGISTRANT’S COMMON EQUITY, RELATED STOCKHOLDER MATTERS AND ISSUER PURCHASES OF EQUITY SECURITIES |
Our common stock is listed on the NASDAQ Global Select Market and trades under the symbol “COLM.” At February 13, 2009, we had approximately 500 shareholders of record.
Following are the quarterly high and low closing prices for our Common Stock for the years ended December 31, 2008 and 2007:
| HIGH | LOW | DIVIDENDS DECLARED | |||||||
| 2008 |
|||||||||
| First Quarter |
$ | 44.74 | $ | 35.80 | $ | 0.16 | |||
| Second Quarter |
$ | 46.26 | $ | 36.75 | $ | 0.16 | |||
| Third Quarter |
$ | 46.98 | $ | 33.72 | $ | 0.16 | |||
| Fourth Quarter |
$ | 40.90 | $ | 28.93 | $ | 0.16 | |||
| 2007 |
|||||||||
| First Quarter |
$ | 66.75 | $ | 54.69 | $ | 0.14 | |||
| Second Quarter |
$ | 70.38 | $ | 62.50 | $ | 0.14 | |||
| Third Quarter |
$ | 69.68 | $ | 55.31 | $ | 0.14 | |||
| Fourth Quarter |
$ | 56.77 | $ | 43.55 | $ | 0.16 | |||
Since the completion of our initial public offering in April 1998 through the third quarter of 2006, we did not declare any dividends. We declared our first quarterly dividend in November 2006. Our current dividend policy is dependent on our earnings, capital requirements, financial condition, restrictions imposed by our credit agreements, and other factors considered relevant by our Board of Directors. For various restrictions on our ability to pay dividends, see Item 7, Management’s Discussion and Analysis of Financial Condition and Results of Operations, and Note 5 of Notes to Consolidated Financial Statements.
20
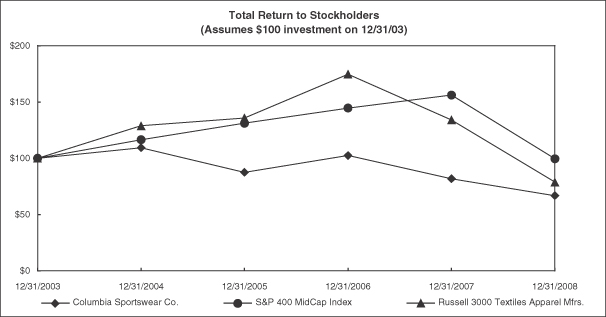
Performance Graph
The line graph below compares the cumulative total shareholder return of our Common Stock with the cumulative total return of the Standard & Poor’s (“S&P”) 400 Mid-Cap Index and the Russell 3000 Textiles Apparel Manufacturers for the period beginning December 31, 2003 and ending December 31, 2008. The graph assumes that $100 was invested on December 31, 2003, and that any dividends were reinvested.
Historical stock price performance should not be relied on as indicative of future stock price performance.
Columbia Sportswear Company
Stock Price Performance
December 31, 2003—December 31, 2008
| Total Return Analysis |
||||||||||||||||||
| 12/31/2003 | 12/31/2004 | 12/31/2005 | 12/31/2006 | 12/31/2007 | 12/31/2008 | |||||||||||||
| Columbia Sportswear Co. |
$ | 100.00 | $ | 109.36 | $ | 87.58 | $ | 102.45 | $ | 81.91 | $ | 66.77 | ||||||
| S&P 400 Mid-Cap Index |
$ | 100.00 | $ | 116.47 | $ | 131.09 | $ | 144.61 | $ | 156.14 | $ | 99.55 | ||||||
| Russell 3000 Textiles Apparel Mfrs. |
$ | 100.00 | $ | 128.84 | $ | 135.78 | $ | 174.78 | $ | 134.12 | $ | 78.91 | ||||||
Securities Authorized for Issuance Under Equity Compensation Plans
See Part III, Item 12, Security Ownership of Certain Beneficial Owners and Management and Related Stockholder Matters, of this Annual Report on Form 10-K for information regarding our securities authorized for issuance under equity compensation plans.
21
Issuer Purchases of Equity Securities
| Period |
Total Number of Shares Purchased |
Average Price Paid per Share |
Total Number of Shares Purchased as Part of Publicly Announced Plans or Programs (1) |
Approximate Dollar Value of Shares that May Yet Be Purchased Under the Plans or Programs— | ||||||
| October 1, 2008 to October 31, 2008 |
112,324 | $ | 39.88 | 112,324 | $ | 100,000,000 | ||||
| November 1, 2008 to November 30, 2008 |
— | — | — | $ | 100,000,000 | |||||
| December 1, 2008 to December 31, 2008 |
— | — | — | $ | 100,000,000 | |||||
| Total |
112,234 | $ | 39.88 | 112,324 | $ | 100,000,000 | ||||
| (1) | Since the inception of our stock repurchase plan in 2004 through December 31, 2008, our Board of Directors has authorized the repurchase of $500,000,000 of our common stock. As of December 31, 2008, we have repurchased 8,694,657 shares under this program at an aggregate purchase price of approximately $400,000,000. Shares of our common stock may be purchased in the open market or through privately negotiated transactions, subject to the market conditions. The repurchase program does not obligate us to acquire any specific number of shares or to acquire shares over any specified period of time. |
22
| Item 6. | SELECTED FINANCIAL DATA |
Selected Consolidated Financial Data
The selected consolidated financial data presented below for, and as of the end of, each of the years in the five-year period ended December 31, 2008 have been derived from our audited consolidated financial statements. The consolidated financial data should be read in conjunction with the Consolidated Financial Statements and Accompanying Notes that appear elsewhere in this annual report and Management’s Discussion and Analysis of Financial Condition and Results of Operations set forth in Item 7.
| Year Ended December 31, | |||||||||||||||
| 2008 | 2007 | 2006 (1) | 2005 | 2004 | |||||||||||
| (In thousands, except per share amounts) | |||||||||||||||
| Statement of Operations Data: |
|||||||||||||||
| Net sales |
$ | 1,317,835 | $ | 1,356,039 | $ | 1,287,672 | $ | 1,155,791 | $ | 1,095,307 | |||||
| Net income |
95,047 | 144,452 | 123,018 | 130,736 | 138,624 | ||||||||||
| Per Share of Common Stock Data: |
|||||||||||||||
| Earnings per share: |
|||||||||||||||
| Basic |
$ | 2.75 | $ | 4.00 | $ | 3.39 | $ | 3.39 | $ | 3.44 | |||||
| Diluted |
2.74 | 3.96 | 3.36 | 3.36 | 3.40 | ||||||||||
| Cash dividends per share |
0.64 | 0.58 | 0.14 | — | — | ||||||||||
| Weighted average shares outstanding: |
|||||||||||||||
| Basic |
34,610 | 36,106 | 36,245 | 38,549 | 40,266 | ||||||||||
| Diluted |
34,711 | 36,434 | 36,644 | 38,943 | 40,812 | ||||||||||
| December 31, | |||||||||||||||
| 2008 | 2007 | 2006 | 2005 | 2004 | |||||||||||
| Balance Sheet Data: |
|||||||||||||||
| Total assets |
$ | 1,148,236 | $ | 1,166,481 | $ | 1,027,289 | $ | 967,640 | $ | 947,625 | |||||
| Long-term obligations, net of current maturities |
15 | 61 | 136 | 7,414 | 12,636 | ||||||||||
| (1) | Effective January 1, 2006, we adopted the fair value recognition provisions of Statement of Financial Accounting Standards (“SFAS”) No. 123R, Share-Based Payment, under which compensation expense is recognized in the Consolidated Statement of Operations for the fair value of employee stock-based compensation. Prior to the adoption of SFAS No. 123R, we accounted for stock-based compensation using the intrinsic value method prescribed in Accounting Principles Board (“APB”) Opinion No. 25, Accounting for Stock Issued to Employees, and related interpretations. Accordingly, under APB Opinion No. 25, no compensation expense was recognized because the exercise price of our employee stock options was equal to the market price of the underlying stock on the date of grant. We applied the disclosure provisions of SFAS No. 123, Accounting for Stock Based Compensation, as amended by SFAS No. 148, Accounting for Stock Based Compensation—Transition and Disclosure, as if the fair value method had been applied in measuring compensation expense. See Note 12 of Notes to Consolidated Financial Statements for further discussion. |
23
| Item 7. | MANAGEMENT’S DISCUSSION AND ANALYSIS OF FINANCIAL CONDITION AND RESULTS OF OPERATIONS |
This Annual Report, including Item 1 of Part I and Items 7 and 7A of Part II, contains forward-looking statements. Forward-looking statements include any statements related to our expectations regarding future performance or market position, including any statements regarding anticipated sales across markets, distribution channels and product categories, access to raw materials and factory capacity, and financing and working capital requirements and resources.
These forward-looking statements, and others we make from time to time, are subject to a number of risks and uncertainties. Many factors may cause actual results to differ materially from those projected in forward-looking statements, including the risks described above in Item 1A, Risk Factors. We do not undertake any duty to either update forward-looking statements after the date they are made or conform them to actual results or to changes in circumstances or expectations.
Our Business
As one of the largest outdoor apparel and footwear companies in the world, we design, develop, market and distribute active outdoor apparel, footwear and related accessories and equipment under the Columbia, Mountain Hardwear, Sorel, Montrail, and Pacific Trail brands. Each of our brands is distributed through a mix of wholesale distribution channels, independent distributors, our own retail stores and licensees.
As a consumer products company, the popularity of outdoor activities and changing design trends affect the desirability of our products. Therefore, we seek to influence, anticipate and respond to trends and shifts in consumer preferences by adjusting the mix of available product offerings, developing new products with innovative performance features and designs, and by creating persuasive and memorable marketing communications to drive consumer awareness and demand. Failure to respond to consumer needs and preferences in a timely and adequate manner could have a material adverse effect on our sales and profitability.
Strategy and Outlook
Our business, like other branded consumer product companies, is heavily dependent upon discretionary consumer spending patterns. Our net sales volumes have been negatively affected by the volatility of the global economy and its impact on consumer purchasing behavior, and retailers’ behavior related to advance orders, order cancellations and seasonal reorders. The current macro-economic environment has caused tightening of credit for some of our wholesale customers, independent distributors and consumers and a significant slowing of retail sales. This has resulted in, and could continue to cause, a more cautious approach by many of our wholesale customers and independent distributors when placing advance orders for seasonal products and reducing, delaying delivery of, or cancelling advance orders placed in earlier periods. In addition, the effects of foreign currency exchange rates may amplify potential net sales decline if the U.S. dollar continues to strengthen compared to foreign currencies in our direct markets. We expect our retail revenues to partially offset some of this anticipated wholesale revenue decline.
We believe that we have appropriately factored into our plans our historical experiences, incremental sales from our new retail stores, and the estimated effect of changes in foreign currency exchange rates. However, unfavorable and unprecedented macro-economic conditions have increased the uncertainty of our planning and forecasts. In this challenging economic environment, we are also mindful of our reliance on the overall financial health of our wholesale customers and their ability to continue to access credit markets to fund their purchases and day-to-day operations.
24
Strategic Growth Initiatives
Our goal is to achieve sustainable, profitable growth by creating innovative products, elevating consumer perception of our brands, increasing consumer and retailer awareness and demand for our products, creating compelling retail environments, and building stronger emotional brand connections with consumers over time. Specifically, our growth strategies include:
| • | designing authentic, innovative products that address activity-specific performance needs of active outdoor enthusiasts. Our goal is to help consumers of every ability enjoy their outdoor lifestyles and activities more comfortably for longer periods; |
| • | expanding our direct-to-consumer business by building a network of branded retail stores in key metropolitan cities, expanding our network of outlet retail stores in the United States, Europe and Canada, and establishing an e-commerce platform. We expect our branded retail stores and e-commerce platform to increase brand awareness and demand for our products by creating compelling retail environments that communicate key marketing initiatives and product innovation, and offering a larger breadth of product assortments than are available in any of our wholesale customers’ stores. In addition, the goal of opening additional outlet retail stores in outlet centers in the United States, Europe and Canada is to support our brands by allowing us to liquidate end-of-season products with less reliance on traditional wholesale and discount channels. We expect this strategy to require significant long-term lease obligations, capital investments in leasehold improvements, information systems, additional personnel and other operating expenses. |
| • | creating and delivering targeted brand-enhancing advertising and marketing programs that communicate distinct, inspiring brand positions for each of our outdoor brands, differentiate our brands from other branded competitors as well as from the private label brands developed and marketed by many of our large retail customers, and result in increasing demand and strong emotional connections with consumers; |
| • | expanding our global footwear business by building a footwear organization with proven skills in designing, developing and marketing innovative, performance-driven products and by expanding distribution into leading footwear retail channels in key markets; |
| • | increasing demand in our European business by offering product assortments and marketing programs that are consistent with our global focus on innovative products, compelling retail presentation and brand-enhancing communications. |
Overview
The following discussion of our results of operations and liquidity and capital resources, including known trends and uncertainties identified by management, should be read in conjunction with the Consolidated Financial Statements and accompanying Notes that appear elsewhere in this annual report.
In 2007, we reclassified our geographical net sales and segment reporting to reflect changes in our internal management and oversight structure as well as growth of the international distributor business. Net sales to international distributors, previously included as part of “Other International,” were regrouped into either the Europe, Middle-East and Africa (“EMEA”) or Latin America and Asia Pacific (“LAAP”) region, in accordance with the markets in which each distributor operates. Previously reported geographical net sales information for fiscal year 2006 has been reclassified to reflect this change.
All references to years relate to the calendar year ended December 31. Highlights for the year ended December 31, 2008 include the following:
| • | Net sales decreased $38.2 million, or 3%, to $1,317.8 million in 2008 from $1,356.0 million in 2007. Changes in foreign currency exchange rates compared to 2007 contributed one percentage point of |
25
| benefit to the consolidated net sales comparison. The decrease in net sales was primarily the result of decreased sales of Columbia-branded products in the United States, EMEA direct and Canada, partially offset by increased sales of Mountain Hardwear-branded products and increased sales in the LAAP region and to our EMEA distributors. |
| • | Our backlog for the spring 2009 selling season, reported as of September 30, 2008, decreased $43.5 million, or 10.5%, to $370.9 million from $414.4 million as of September 30, 2007. Changes in foreign currency exchange rates compared to 2007 contributed less than one percentage point of benefit to the spring 2009 backlog comparison. The decrease in our spring backlog was the result of a decline in orders in the United States, EMEA and Canada driven primarily by a decline in orders of Columbia-branded sportswear. Although we cannot predict with certainty any future results, our reported backlog is one indicator of our anticipated net sales for the spring 2009 selling season. Many factors, however, could cause actual sales to differ materially from reported order backlog, including cancellation of orders by customers, changes in foreign currency exchange rates and continued deterioration of macroeconomic conditions. We expect that incremental sales through our expanded base of branded and outlet retail stores will partially offset some of the anticipated wholesale sales decline for the spring 2009 season. Moreover, our spring 2009 backlog should not be used in forecasting sales beyond the spring 2009 selling season. |
| • | Gross profit increased 30 basis points to 43.1% in 2008 from 42.8% in 2007. Gross profit margins expanded as a result of a lower volume of close-out product sales and an increase in average selling prices, partially offset by the negative effects of an increased mix of sales to distributors, which carry lower margins than wholesale customers, and the effects of changes in foreign currency exchange rates. |
| • | Selling, general and administrative expense increased $44.6 million, or 12%, to $430.4 million in 2008 from $385.8 million in 2007. This increase was primarily due to our planned investment in incremental marketing activities in 2008 to drive consumer demand for our brands, together with initial investment and incremental operating costs of our new retail stores. |
| • | A non-cash pre-tax charge of $24.7 million, or $0.46 per diluted share after-tax, was incurred in the fourth quarter of 2008 for the write-down of acquired intangible assets related to our acquisitions of the Pacific Trail and Montrail brands in 2006. The impairment charge related primarily to goodwill and trademarks and resulted from our annual evaluation of intangible asset values. |
| • | Net income decreased 34% to $95.0 million in 2008 from $144.5 million in 2007, and diluted earnings per share decreased to $2.74 in 2008, including a $0.46 per diluted share after-tax impairment charge, compared to $3.96 in 2007. 2008 net income was unfavorably affected by reduced revenues, increased selling, general and administrative expenses and the non-cash pre-tax impairment charge, partially offset by a lower effective tax rate in 2008 compared to 2007. Our effective tax rate was 24.7% in 2008 compared to 30.6% in 2007. The reduced 2008 tax rate resulted primarily from a higher proportion of our income being generated in foreign jurisdictions with lower overall tax rates, increased foreign tax credits and the favorable conclusion of a European tax examination. |
| • | Since the inception of our stock repurchase plan in 2004 through December 31, 2008, our Board of Directors has authorized the repurchase of $500 million of our common stock. As of December 31, 2008, we have repurchased 8,694,657 shares under this program at an aggregate purchase price of approximately $400 million. Shares of our common stock may be purchased in the open market or through privately negotiated transactions, subject to market conditions. The repurchase program does not obligate us to acquire any specific number of shares or to acquire shares over any specified period of time. |
26
| Year Ended December 31, | |||||||||
| 2008 | 2007 | % Change | |||||||
| (In millions, except for percentage changes) | |||||||||
| Geographical Net Sales to Unrelated Entities: |
|||||||||
| United States |
$ | 727.7 | $ | 767.2 | (5 | )% | |||
| EMEA |
267.2 | 287.0 | (7 | )% | |||||
| LAAP |
198.2 | 175.7 | 13 | % | |||||
| Canada |
124.7 | 126.1 | (1 | )% | |||||
| $ | 1,317.8 | $ | 1,356.0 | (3 | )% | ||||
| Categorical Net Sales to Unrelated Entities: |
|||||||||
| Sportswear |
$ | 540.9 | $ | 565.6 | (4 | )% | |||
| Outerwear |
491.7 | 497.6 | (1 | )% | |||||
| Footwear |
217.2 | 227.4 | (4 | )% | |||||
| Accessories and Equipment |
68.0 | 65.4 | 4 | % | |||||
| $ | 1,317.8 | $ | 1,356.0 | (3 | )% | ||||
| Brand Net Sales to Unrelated Entities: |
|||||||||
| Columbia |
$ | 1,162.0 | $ | 1,211.2 | (4 | )% | |||
| Mountain Hardwear |
95.0 | 82.6 | 15 | % | |||||
| Sorel |
48.1 | 45.6 | 5 | % | |||||
| Montrail |
10.2 | 12.7 | (20 | )% | |||||
| Pacific Trail |
2.5 | 3.9 | (36 | )% | |||||
| $ | 1,317.8 | $ | 1,356.0 | (3 | )% | ||||
Although we cannot predict future results with certainty and despite current global economic conditions, we are committed to our demand creation and retail expansion strategies to stimulate increased consumer demand and improve inventory management with minimal disruption to our wholesale distribution channels. With our commitment to investment in these strategies, a well-developed sourcing and distribution infrastructure and a proven design and product development team, we believe that we are well positioned to establish sustainable platforms that will support long-term growth and profitability.
Results of Operations
Net income decreased $49.5 million, or 34%, to $95.0 million in 2008 from $144.5 million in 2007. Diluted earnings per share decreased to $2.74 in 2008, including a $0.46 per diluted share after-tax impairment charge, from $3.96 in 2007. Net income increased $21.5 million, or 17%, to $144.5 million in 2007 from $123.0 million in 2006. Diluted earnings per share increased to $3.96 in 2007 from $3.36 in 2006.
The following table sets forth, for the periods indicated, the percentage relationship to net sales of specified items in our Consolidated Statements of Operations:
| 2008 | 2007 | 2006 | |||||||
| Net sales |
100.0 | % | 100.0 | % | 100.0 | % | |||
| Cost of sales |
56.9 | 57.2 | 58.0 | ||||||
| Gross profit |
43.1 | 42.8 | 42.0 | ||||||
| Selling, general and administrative expense |
32.7 | 28.5 | 28.5 | ||||||
| Impairment of acquired intangible assets |
1.9 | — | — | ||||||
| Net licensing income |
0.5 | 0.4 | 0.5 | ||||||
| Income from operations |
9.0 | 14.7 | 14.0 | ||||||
| Interest income, net |
0.6 | 0.6 | 0.4 | ||||||
| Income before income tax |
9.6 | 15.3 | 14.4 | ||||||
| Income tax expense |
(2.4 | ) | (4.6 | ) | (4.8 | ) | |||
| Net income |
7.2 | % | 10.7 | % | 9.6 | % | |||
27
Year Ended December 31, 2008 Compared to Year Ended December 31, 2007
Net Sales: Consolidated net sales decreased $38.2 million, or 3%, to $1,317.8 million in 2008 from $1,356.0 million in 2007. Changes in foreign currency exchange rates compared to 2007 contributed one percentage point of benefit to the consolidated net sales comparison. The decrease in net sales was led by the United States, followed by the EMEA region and Canada, partially offset by increased net sales in the LAAP region. By product category, the reduction in net sales was led by sportswear, followed by footwear and outerwear, partially offset by increased net sales of accessories and equipment.
Sales by Product Category
Net sales of sportswear decreased $24.7 million, or 4%, to $540.9 million in 2008 from $565.6 million in 2007. The decrease in sportswear net sales was predominantly the result of decreased net sales in the United States, followed by the EMEA region, offset by increased net sales in the LAAP region and Canada. The sportswear net sales decrease was led by the United States wholesale business for the Columbia brand, partially offset by incremental net sales through our expanded base of branded and outlet retail stores. We primarily attribute the decrease in wholesale net sales of sportswear to the lower initial order volumes and the weak U.S. retail environment resulting from difficult macro-economic conditions.
Net sales of outerwear decreased $5.9 million, or 1%, to $491.7 million in 2008 from $497.6 million in 2007. The decrease in outerwear net sales was led by the United States, followed by the EMEA region and Canada, partially offset by an increase in the LAAP region. The decrease in outerwear net sales was predominantly the result of decreased sales of the Columbia brand in the United States wholesale and EMEA direct businesses. The decrease in both regions was primarily the result of lower initial order volumes for the spring and fall 2008 seasons as well as the weak retail environment resulting from difficult macro-economic conditions. The decrease in sales of Columbia-branded outerwear was partially offset by increased sales of Mountain Hardwear-branded outerwear.
Net sales of footwear decreased $10.2 million, or 4%, to $217.2 million in 2008 from $227.4 million in 2007. The decrease in footwear net sales was led by the EMEA region, followed by Canada, partially offset by increased net sales of footwear in the LAAP region and the United States. The decrease in footwear net sales in the EMEA region was led by EMEA direct footwear net sales, followed by EMEA distributor net sales. The decrease in EMEA direct footwear net sales was primarily the result of lower initial order volumes due to continued product assortment and marketing challenges, coupled with economic uncertainty in that region. The decrease in EMEA distributor footwear net sales was primarily a result of earlier shipments of spring 2008 product that occurred in the fourth quarter of 2007.
Net sales of accessories and equipment increased $2.6 million, or 4%, to $68.0 million in 2008 from $65.4 million in 2007. Accessories and equipment sales growth was led by the LAAP region, followed by Canada, partially offset by a decrease in net sales in the United States, while net sales of accessories and equipment remained flat in the EMEA region.
Sales by Geographic Region
Net sales in the United States decreased $39.5 million, or 5%, to $727.7 million in 2008 from $767.2 million in 2007. The reduction in net sales in the United States was led by sportswear, followed by outerwear and accessories and equipment, while sales of footwear remained essentially flat. The net sales decrease was led by the wholesale business for the Columbia brand, partially offset by increased net sales through our expanded base of branded and outlet retail stores. During 2008 we opened 15 new outlet retail stores and 5 branded retail stores in the United States, ending the year with 28 outlet retail stores and 8 branded retail stores in the United States.
Net sales in the EMEA region decreased $19.8 million, or 7%, to $267.2 million in 2008 from $287.0 million in 2007. Changes in foreign currency exchange rates contributed five percentage points of benefit to
28
EMEA net sales compared to 2007. The decrease in net sales in the EMEA region was led by footwear, followed by outerwear and sportswear, while net sales of accessories and equipment remained essentially flat. The decrease in net sales in the EMEA region included a decrease in EMEA direct net sales, partially offset by an increase in net sales to EMEA distributors. The decrease in EMEA direct net sales was the result of lower initial order volumes for the spring and fall 2008 seasons due to continued product assortment and marketing challenges, coupled with economic uncertainty in the region. The increase in net sales to EMEA distributors primarily reflects increased Columbia-branded outerwear and sportswear net sales to our largest distributor in the region.
Net sales in the LAAP region increased $22.5 million, or 13%, to $198.2 million in 2008 from $175.7 million in 2007. Changes in foreign currency exchange rates contributed less than one percentage point of benefit to LAAP net sales compared to 2007. Sales growth in the LAAP region was led by our Japan business, which benefited from foreign currency exchange rates, followed by our LAAP distributor business, while net sales in Korea remained essentially flat, including a negative impact from foreign currency exchange rates. The increase in Japan net sales was primarily the result of growth in our retail business as well as continued expansion with key wholesale partners, particularly in the sports chain channel.
Net sales in Canada decreased $1.4 million, or 1%, to $124.7 million in 2008 from $126.1 million in 2007. Changes in foreign currency exchange rates contributed two percentage points of benefit to Canada net sales compared to 2007. The decrease in net sales in Canada was led by outerwear, followed by footwear, partially offset by increased net sales of sportswear and accessories and equipment. The decrease in outerwear was primarily attributable to lower initial order volumes of Columbia-branded products for the fall 2008 season, partially offset by incremental sales of Mountain Hardwear-branded products that were previously sold through third party distributors.
Gross Profit: Gross profit as a percentage of net sales increased to 43.1% in 2008 from 42.8% in 2007. Gross profit margins expanded in all of our product categories primarily due to a lower volume of close-out product sales and an increase in average selling prices, partially offset by the negative effects of an increased mix of sales to distributors, which carry lower margins than wholesale customers, and the effects of changes in foreign currency exchange rates.
A decrease in 2008 close-out product sales at slightly lower gross margins compared to 2007 had a favorable affect on our consolidated gross profits. We primarily attribute this decrease to earlier close-out sales of fall 2007 product in the fourth quarter of 2007.
Our gross profits may not be comparable to those of other companies in our industry because some include all of the costs related to their distribution network in cost of sales. We, like others, have chosen to include these expenses as a component of selling, general and administrative expense.
Selling, General and Administrative Expense: Selling, general and administrative expense (“SG&A”) includes all costs associated with our design, merchandising, marketing, distribution and corporate functions including related depreciation and amortization.
SG&A expense increased $44.6 million, or 12%, to $430.4 million in 2008 from $385.8 million in 2007. Selling expenses increased $8.2 million, or 7%, while general and administrative expenses increased $36.4 million, or 13%. As a percentage of net sales, SG&A expense increased to 32.7% of net sales in 2008 from 28.5% of net sales in 2007.
Selling expenses, including commissions and advertising, increased to 9.2% of net sales in 2008 from 8.3% of net sales in 2007. We attribute the increase in selling expenses as a percentage of net sales to our increased marketing investments to drive consumer demand for our brands, which was amplified by a decrease in consolidated net sales in 2008 compared with the same period in 2007.
29
The increase in general and administrative expenses primarily resulted from the start-up and operational costs of our new retail stores. Depreciation and amortization included in SG&A expense totaled $30.1 million for 2008, compared to $29.3 million for the same period in 2007. We expect SG&A to continue to increase as we pursue our retail expansion strategies.
Impairment of Acquired Intangible Assets: We incurred a $24.7 million non-cash pre-tax charge, or approximately $0.46 per diluted share after tax, for the write-down of acquired intangible assets related to our acquisitions of the Pacific Trail and Montrail brands in 2006. The impairment charge related primarily to goodwill and trademarks and resulted from our annual evaluation of intangible asset values. These brands have not achieved our sales and profitability objectives and the deterioration in the macro-economic environment and resulting effect on consumer demand have decreased the probability of realizing these objectives in the near future. Going forward we remain committed to marketing and distributing Montrail-branded footwear through the outdoor specialty, running specialty and sporting goods channels. Beginning in 2009, Pacific Trail products will be sold solely through licensing arrangements.
Net Licensing Income: Net licensing income increased $0.8 million, or 15%, to $6.0 million in 2008 from $5.2 million in 2007. In 2008, licensing income was led by Columbia-branded leather accessories, followed by Columbia-branded socks, eyewear, insulated products including soft-sided coolers, and camping gear.
Interest Income, Net: Interest income was $7.6 million in 2008 compared to $9.0 million in 2007. The decrease in interest income was primarily due to lower average investment yields compared with the same period in 2007. Interest expense was nominal in 2008 and 2007.
Income Tax Expense: Our provision for income taxes decreased to $31.2 million in 2008 from $63.6 million in 2007. This decrease resulted from lower income before tax combined with a decrease in our effective income tax rate to 24.7% in 2008 compared to 30.6% in 2007. The decrease in our tax rate resulted primarily from generating a higher proportion of our income in foreign jurisdictions with lower overall tax rates, increased foreign tax credits and the favorable conclusion of a European tax examination.
Year Ended December 31, 2007 Compared to Year Ended December 31, 2006
Net Sales: Consolidated net sales increased $68.3 million, or 5%, to $1,356.0 million in 2007 from $1,287.7 million in 2006. Changes in foreign currency exchange rates compared with 2006 contributed two percentage points of consolidated net sales growth. Increased net sales were realized in each major geographic region in which we operate, led by LAAP, followed by the United States, EMEA and Canada. By product category, increased net sales were led by sportswear, followed by footwear, accessories and equipment, while sales of outerwear remained essentially flat. Sales growth was primarily the result of an increase in the quantity of units sold in each geographic region.
Sales by Product Category
Net sales of sportswear increased $56.5 million, or 11%, to $565.6 million in 2007 from $509.1 million in 2006. As a result of continued strength in our sportswear business, it remained our largest product category, representing 41.7% of total sales. We primarily attribute the increase in sportswear sales to higher sales in the United States, followed by EMEA, LAAP and Canada. The increase in sportswear sales was driven by a broader assortment of products, competitive pricing and related consumer demand, particularly for fleece sweaters, knitted and woven tops and pants.
Net sales of outerwear increased $1.1 million, or less than 1%, to $497.6 million in 2007 from $496.5 million in 2006. We primarily attribute the increase in outerwear sales to an increase in sales in LAAP, followed by Canada, while sales of outerwear decreased in EMEA and the United States. Outerwear sales growth was
30
driven by increased sales of our Columbia and Mountain Hardwear brands across all regions, except EMEA direct. Growth in Columbia-branded outerwear sales in the United States was largely offset by a significant decrease in Pacific Trail outerwear sales. The decrease in outerwear sales in EMEA direct was primarily due to the extended periods of unseasonably warm weather conditions throughout Western Europe during the fall and winter seasons of 2006, which resulted in lower pre-season orders from retailers for the 2007 fall season.
Net sales of footwear increased $7.7 million, or 4%, to $227.4 million in 2007 from $219.7 million in 2006. Footwear sales growth was led by LAAP, followed by EMEA and Canada, while sales of footwear decreased in the United States. We primarily attribute the increase in international footwear sales to higher sales of men’s and women’s spring footwear to key international distributor markets in the LAAP and EMEA regions. The decrease in footwear sales in the United States was primarily due to higher than average volumes of fall 2006 Columbia and Sorel cold weather footwear product remaining in inventories at retailers resulting in lower orders from those retailers for fall 2007 products.
Net sales of accessories and equipment increased $3.0 million, or 5%, to $65.4 million in 2007 from $62.4 million in 2006. Accessories and equipment sales growth was led by LAAP, followed by the United States and EMEA, partially offset by a decrease in net sales in Canada. The increase in sales of accessories and equipment in our LAAP region was primarily related to expanded distribution and increased consumer demand.
Sales by Geographic Region
Net sales in the United States increased $15.2 million, or 2%, to $767.2 million in 2007 from $752.0 million in 2006. The increase in net sales in the United States was attributable to increased sales of sportswear, followed by accessories and equipment, while sales of footwear and outerwear decreased. Sportswear sales growth was primarily attributable to strong sales of fleece and sweaters. Growth in sales of Columbia-branded outerwear was largely offset by a significant decrease in Pacific Trail outerwear sales. The decrease in footwear sales was primarily due to higher than average volumes of fall 2006 Columbia and Sorel cold weather footwear product remaining in inventories at retailers resulting in lower orders from those retailers for fall 2007 products and to a lesser degree, a decrease in Montrail footwear sales.
Net sales in the EMEA region increased $14.4 million, or 5%, to $287.0 million in 2007 from $272.6 million in 2006. Changes in foreign currency exchange rates compared with 2006 contributed six percentage points of EMEA net sales growth. The increase in net sales in the EMEA region was led by sportswear, followed by footwear and accessories and equipment, partially offset by a decrease in outerwear sales. Our EMEA direct business was negatively affected by extended periods of unseasonably warm weather conditions throughout Western Europe during the fall and winter seasons of 2006, which resulted in lower pre-season orders from retailers buying less outerwear for the 2007 fall season. EMEA direct net sales decreased as the result of decreased sales in the United Kingdom, Italy and Spain. In response to business challenges in EMEA direct, we reorganized our European management team in the second half of 2007 and reestablished strong connections between our European and U.S. product teams to ensure more direction and interaction as we realign our European product assortments with consumers’ expectations. Our EMEA distributor business growth was largely the result of increased sales of outerwear, sportswear and footwear by our distributor in Russia.
Net sales in the LAAP region increased $32.8 million, or 23%, to $175.7 million in 2007 from $142.9 million in 2006. Changes in foreign currency exchange rates compared with 2006 contributed one percentage point of LAAP net sales growth. Sales growth in the LAAP region was led by our LAAP distributor business, followed by our Korea and Japan businesses. Sales growth was led by footwear, followed by sportswear, outerwear and accessories and equipment. Sales growth by our LAAP distributors was largely the result of increased sales by our distributor in China, primarily due to increased sales of footwear. The increase in Korea sales resulted from the opening of new stores and continued growth of Columbia outerwear sales. Japan sales growth resulted from more favorable weather during the fourth quarter of 2007 as well as increased sales from our own retail channel.
31
Net sales in Canada increased $5.9 million, or 5%, to $126.1 million in 2007 from $120.2 million in 2006. Changes in foreign currency exchange rates compared with 2006 contributed five percentage points of Canada’s net sales growth. Sales growth was led by sportswear, followed by outerwear and footwear, while sales of accessories and equipment decreased. Cold weather conditions during the fourth quarter of 2007 resulted in a higher volume of close-out product sales compared to the same period in 2006.
Gross Profit: Gross profit as a percentage of net sales increased to 42.8% in 2007 from 42.0% in 2006. We primarily attribute the increase in gross profit margin to modest increases in our average selling prices on spring 2007 products, lower freight costs and favorable hedged currency rates. The favorable gross profit effect of these items was partially offset by increased sales of spring and fall close-out product and higher international distributor shipments, both at lower gross margins.
Improvement in foreign currency hedge rates for our spring and fall 2007 selling seasons favorably affected our gross profit. Since our global supply of inventory is generally purchased with U.S. dollars, the gross profit of our direct international businesses is partially dependent on the valuation of the U.S. dollar. For our spring and fall 2007 selling seasons, the hedge rates for our European and Canadian direct businesses improved from our spring and fall 2006 selling seasons.
An increase in 2007 close-out product sales at lower gross margins compared to 2006 had a negative effect on our consolidated gross profits. We primarily attribute this increase to elevated close-out sales levels in 2007, due to unseasonably cool weather conditions in the early part of the spring season in the United States and earlier shipments of fall 2007 close-outs compared to 2006.
Selling, General and Administrative Expense: SG&A expense increased $19.0 million, or 5%, to $385.8 million in 2007 from $366.8 million in 2006. Selling expenses decreased $1.6 million, or 1%, while general and administrative expenses increased $20.6 million, or 8%. As a percentage of net sales, SG&A remained flat at 28.5% for 2007 and 2006.
Selling expenses, including commissions and advertising, decreased to 8.3% of net sales for 2007 from 8.9% of net sales for 2006. We largely attribute the decrease in selling expenses as a percentage of net sales to reduced commission rates in the United States and changes to our sales agency structures in Europe as well as lower advertising expenses, offset by increased promotional spending and sample costs.
The increase in general and administrative expenses primarily resulted from an increase in depreciation expense and personnel related costs. Depreciation and amortization included in general and administrative expenses totaled $29.3 million for 2007 compared to $22.5 million for 2006. The increase in depreciation expense is primarily related to the Portland, Oregon and Cambrai, France distribution center projects. The increase in personnel related costs was to support our growth initiatives.
Net Licensing Income: Net licensing income decreased $0.3 million, or 5%, to $5.2 million in 2007 from $5.5 million in 2006. Licensing income in 2007 was led by Columbia licensed socks, followed by licensed leather accessories, bicycles, camping gear, and eyewear.
Interest Income, Net: Interest income was $9.0 million in 2007 compared to $6.8 million in 2006. The increase in interest income was primarily due to a higher combined cash equivalents and short-term investments balance compared to the same period in 2006. Interest expense decreased to $0.1 million in 2007 from $1.2 million in 2006. We primarily attribute the decrease in interest expense to a reduction in notes payable.
Income Tax Expense: Our provision for income taxes increased to $63.6 million in 2007 from $62.3 million in 2006. This increase resulted from higher income before tax offset by a decrease in our effective income tax rate to 30.6% in 2007 compared to 33.6% in 2006. The lower rate in 2007 was primarily the result of the favorable conclusion of various United States and European tax examinations and the geographic mix of taxable income.
32
Liquidity and Capital Resources
Our primary ongoing funding requirements are for working capital, investing activities associated with the expansion of our global operations and general corporate needs. At December 31, 2008, we had total cash and cash equivalents of $230.6 million compared to $192.0 million at December 31, 2007. In addition, we had short-term investments of $22.4 million at December 31, 2008 compared to $81.6 million at December 31, 2007.
Net cash provided by operating activities was $144.9 million in 2008 compared to $124.3 million in 2007. The increase in cash provided by operating activities was primarily the result of a reduction in inventory in 2008 compared to a significant increase in inventory in 2007 partially offset by lower net income, excluding the non-cash pre-tax charge for the impairment of acquired intangible assets, in 2008 compared to 2007.
Net cash provided by investing activities was $11.7 million in 2008 compared to $41.8 million in 2007. In 2008, our investing activities primarily consisted of net liquidation of short-term investments of $59.2 million partially offset by capital expenditures of $54.3 million, of which $6.7 million was incurred but not yet paid. Capital expenditures in 2008 consisted of approximately $12.8 million in maintenance capital expenditures and $41.5 million for retail expansion and other capacity initiatives. In 2007, our investing activities primarily consisted of net liquidation of short-term investments of $73.7 million partially offset by capital expenditures of $34.3 million, of which $2.3 million was incurred but not yet paid. Capital expenditures in 2007 consisted of approximately $10 million in maintenance capital expenditures and $24 million for other capacity and growth initiatives.
Cash used in financing activities was $102.4 million in 2008 compared to $40.4 million in 2007. In 2008, net cash used in financing activities included the repurchase of common stock at an aggregate price of $83.9 million, dividend payments of $22.1 million, partially offset by proceeds from the issuance of common stock under employee stock plans of $3.5 million. In 2007, net cash used in financing activities included the repurchase of common stock at an aggregate price of $31.8 million, dividends payments of $20.9 million, the net repayments of notes payable of $3.6 million, partially offset by proceeds from the issuance of common stock under employee stock plans of $14.2 million.
To fund our domestic working capital requirements, we have available unsecured revolving lines of credit with aggregate seasonal limits ranging from $50 million to $125 million, of which $25 million to $100 million is committed. At December 31, 2008, no balance was outstanding under these lines of credit and we were in compliance with all associated covenants. Internationally, our subsidiaries have local currency operating lines in place guaranteed by us with a combined limit of approximately $115.5 million at December 31, 2008, of which $3.5 million is designated as a European customs guarantee. At December 31, 2008, no balance was outstanding under these lines of credit.
In 2009, we intend to open additional branded and outlet retail stores, primarily in the United States and Europe. We expect to fund our future capital expenditures with existing cash, operating cash flows and credit facilities. If the need arises for additional expenditures, we may need to seek additional funding. Our ability to obtain additional financing will depend on many factors, including prevailing market conditions, our financial condition, and our ability to negotiate favorable terms and conditions. Financing may not be available on terms that are acceptable or favorable to us, if at all.
Our operations are affected by seasonal trends typical in the outdoor apparel industry, and have historically resulted in higher sales and profits in the third calendar quarter. This pattern has resulted primarily from the timing of shipments to wholesale customers for the fall season. We believe that our liquidity requirements for at least the next 12 months will be adequately covered by existing cash, cash provided by operations and existing short-term borrowing arrangements.
33
The following table presents our estimated contractual commitments (in thousands):
| Year ending December 31, | |||||||||||||||||||||
| 2009 | 2010 | 2011 | 2012 | 2013 | Thereafter | Total | |||||||||||||||
| Installment payments (1) |
$ | 63 | $ | 15 | $ | — | $ | — | $ | — | $ | — | $ | 78 | |||||||
| Inventory purchase obligations (2) |
157,774 | — | — | — | — | — | 157,774 | ||||||||||||||
| Operating leases (3): |
|||||||||||||||||||||
| Non-related parties |
21,134 | 21,504 | 19,871 | 18,998 | 18,613 | 133,565 | 233,685 | ||||||||||||||
| Related party |
478 | 478 | 478 | — | — | — | 1,434 | ||||||||||||||
We have recorded liabilities for net unrecognized tax benefits related to income tax uncertainties in our Consolidated Balance Sheet at December 31, 2008 of approximately $22.4 million; however, they have not been included in the table above because we are uncertain about whether or when such amounts may be settled. See Note 9 of Notes to Consolidated Financial Statements.
| (1) | Installment payments consist of purchase obligations made in the ordinary course of business for non-product purchases. The amounts represent the minimum payments required, including any imputed interest, by contracts and agreements. |
| (2) | Inventory purchase obligations consist of open production purchase orders for sourced apparel, footwear, accessories and equipment, and materials used to manufacture apparel. The reported amounts exclude product purchase liabilities included in accounts payable on the Consolidated Balance Sheet at December 31, 2008. |
| (3) | Operating lease obligations include retail space operating leases, which often include real estate taxes, insurance, common area maintenance (“CAM”), and other costs in addition to base rent. Operating lease obligations listed above do not include real estate taxes, insurance, CAM, and other costs for which we are obligated. Total expense related to real estate taxes, insurance, CAM, and other costs related to these leases for the year ended December 31, 2008 was $3.8 million and is included in SG&A expense in the Consolidated Statement of Operations. These operating lease commitments are not reflected on the Consolidated Balance Sheet. |
Off-Balance Sheet Arrangements
We maintain unsecured and uncommitted lines of credit with a combined limit of $150.0 million at December 31, 2008, available for issuing import letters of credit. At December 31, 2008, we had letters of credit outstanding of $8.3 million issued for purchase orders for inventory.
Quantitative and Qualitative Disclosures About Market Risk
In the normal course of business, our financial position and results of operations are routinely subject to a variety of risks, including market risk associated with interest rate movements on borrowings and investments and exchange rate movements on non-U.S. dollar currency denominated assets, liabilities, income and expenses. We regularly assess these risks and have established policies and business practices that should result in an appropriate level of protection against the adverse effect of these and other potential exposures. We do not engage in speculative trading in any financial market.
Our foreign currency risk management objective is to mitigate the uncertainty of anticipated cash flows attributable to changes in exchange rates. We focus on anticipated cash flows resulting from firmly and non-firmly committed inventory purchases and the related receivables and payables, including third party or intercompany transactions.
We manage this risk primarily by using currency exchange, option and swap contracts. Anticipated, but not yet firmly committed, transactions that we hedge carry a high level of certainty and are expected to be recognized
34
within one year. We use cross-currency swaps to hedge foreign currency denominated payments related to intercompany loan agreements. Hedged transactions are denominated primarily in European euros, Canadian dollars, and Japanese yen.
The fair value of our hedging contracts was favorable by approximately $1.8 million at December 31, 2008 and unfavorable by approximately $3.1 million at December 31, 2007. A 10% change in the euro, Canadian dollar and yen exchange rates would have resulted in the fair value fluctuating approximately $6.2 million at December 31, 2008 and $9.8 million at December 31, 2007. Changes in fair value, resulting from foreign exchange rate fluctuations, would be substantially offset by the change in value of the underlying hedged transactions.
Our exposure to market risk for changes in interest rates relates primarily to our debt obligations. We did not have any long-term debt obligations at December 31, 2008 or 2007. We have cash flow exposure on our committed and uncommitted bank lines of credit since the interest is indexed to various reference rates such as Prime and LIBOR. At December 31, 2008 and 2007, our bank lines of credit did not have a balance.
Critical Accounting Policies and Estimates
Management’s discussion and analysis of our financial condition and results of operations are based on our consolidated financial statements, which have been prepared in accordance with GAAP. The preparation of these financial statements requires us to make various estimates and judgments that affect reported amounts of assets, liabilities, sales, cost of sales and expenses and related disclosure of contingent assets and liabilities. We believe that the estimates, assumptions and judgments involved in the accounting policies described below have the greatest potential impact on our financial statements, so we consider these to be our critical accounting policies and estimates. Because of the uncertainty inherent in these matters, actual results could differ from the estimates we use in applying the critical accounting policies. We base our ongoing estimates on historical experience and other various assumptions that we believe to be reasonable under the circumstances. Many of these critical accounting policies affect working capital account balances, including the policy for revenue recognition, the allowance for uncollectible accounts receivable, the provision for potential excess, close-out and slow moving inventory, product warranty, income taxes and stock-based compensation.
Management and our independent auditors regularly discuss with our audit committee each of our critical accounting estimates, the development and selection of these accounting estimates, and the disclosure about each estimate in Management’s Discussion and Analysis of Financial Condition and Results of Operations. These discussions typically occur at our quarterly audit committee meetings and include the basis and methodology used in developing and selecting these estimates, the trends in and amounts of these estimates, specific matters affecting the amount of and changes in these estimates, and any other relevant matters related to these estimates, including significant issues concerning accounting principles and financial statement presentation.
Revenue Recognition
We record wholesale and licensed product revenues when title passes and the risks and rewards of ownership have passed to the customer, based on the terms of sale. Title generally passes upon shipment or upon receipt by the customer depending on the country of the sale and the agreement with the customer. Retail store revenues are recorded at the time of sale.
In some countries outside of the United States where title passes upon receipt by the customer, predominantly where we sell directly in Western Europe, precise information regarding the date of receipt by the customer is not readily available. In these cases, we estimate the date of receipt by the customer based on historical and expected delivery times by geographic location. We periodically test the accuracy of these estimates based on actual transactions. Delivery times vary by geographic location, generally from one to five days. To date, we have found these estimates to be materially accurate.
35
At the time of revenue recognition, we also provide for estimated sales returns and miscellaneous claims from customers as reductions to revenues. The estimates are based on historical rates of product returns and claims. However, actual returns and claims in any future period are inherently uncertain and thus may differ from the estimates. If actual or expected future returns and claims are significantly greater or lower than the reserves that we have established, we will record a reduction or increase to net revenues in the period in which we make such a determination. Over the three year period ended December 31, 2008, our actual annual sales returns and miscellaneous claims from customers were approximately two percent of net sales.
Allowance for Uncollectible Accounts Receivable
We make ongoing estimates of the uncollectibility of our accounts receivable and maintain an allowance for estimated losses resulting from the inability of our customers to make required payments. In determining the amount of the allowance, we consider our historical level of credit losses and we make judgments about the creditworthiness of customers based on ongoing credit evaluations. We analyze specific customer accounts, customer concentrations, credit insurance coverage, standby letters of credit, current economic trends, and changes in customer payment terms. Current credit and market conditions may slow our collection efforts as customers experience increased difficulty in accessing credit and paying their obligations, leading to higher than normal accounts receivable. Because we cannot predict future changes in the financial stability of our customers, actual future losses from uncollectible accounts may differ from our estimates and may have a material effect on our consolidated financial position, results of operations or cash flows. If the financial condition of our customers deteriorates and results in their inability to make payments, a larger allowance may be required. If we determine that a smaller or larger allowance is appropriate, we will record a credit or a charge to SG&A expense in the period in which we make such a determination.
Inventory Obsolescence and Product Warranty
We make ongoing estimates of potential future excess, close-out or slow moving inventory and product warranty costs. We evaluate our inventory on hand considering our purchase commitments, sales forecasts, and historical experience to identify excess, close-out or slow moving inventory and make provisions as necessary to properly reflect inventory value at the lower of cost or estimated market value. When we evaluate our reserve for warranty costs, we consider our historical claim rates by season, product mix, current economic trends, and the historical cost to repair, replace, or refund the original sale. If we determine that a smaller or larger reserve is appropriate, we will record a credit or a charge to cost of sales in the period we make such a determination.
Income Taxes
We use the asset and liability method of accounting for income taxes. Under this method, we recognize income tax expense for the amount of taxes payable or refundable for the current year and for the amount of deferred tax liabilities and assets for the future tax consequences of events that have been recognized in our financial statements or tax returns. We make assumptions, judgments and estimates to determine our current provision for income taxes, our deferred tax assets and liabilities, and our uncertain tax positions in accordance with Financial Accounting Standards Interpretation No. 48 (“FIN 48”), Accounting for Uncertainty in Income Taxes—an interpretation of FASB Statement No. 109. Our judgments, assumptions and estimates relative to the current provision for income tax take into account current tax laws, our interpretation of current tax laws and possible outcomes of current and future audits conducted by foreign and domestic tax authorities. Changes in tax law or our interpretation of tax laws and the resolution of current and future tax audits could significantly affect the amounts provided for income taxes in our consolidated financial statements. Our assumptions, judgments and estimates relative to the value of a deferred tax asset take into account predictions of the amount and category of future taxable income. Actual operating results and the underlying amount and category of income in future years could cause our current assumptions, judgments and estimates of recoverable net deferred taxes to be inaccurate. Changes in any of the assumptions, judgments and estimates mentioned above could cause our actual income tax obligations to differ from our estimates, which could materially affect our financial position and results of operations.
36
On a quarterly basis, we estimate what our effective tax rate will be for the full fiscal year and record an appropriate quarterly income tax provision, in accordance with the anticipated effective rate. As the calendar year progresses, we periodically refine our estimate based on actual events and earnings by jurisdiction during the year. This ongoing estimation process can result in changes to our expected effective tax rate for the full calendar year. When this occurs, we adjust the income tax provision during the quarter in which the change in estimate occurs so that our year-to-date provision equals our expected annual effective tax rate.
Stock-Based Compensation
We account for stock-based compensation in accordance with Statement of Financial Accounting Standards (“SFAS”) No. 123(R), Share-Based Payment. Under the provisions of SFAS No. 123R, stock-based compensation cost is estimated at the grant date based on the award’s fair value and is recognized as expense over the requisite service period using the straight-line attribution method. As allowed under SFAS No. 123R, we estimate stock-based compensation for stock options granted using the Black-Scholes option pricing model, which requires various highly subjective assumptions, including volatility and expected option life. Further, as required under SFAS No. 123R, we estimate forfeitures for stock-based awards granted, which are not expected to vest. If any of these inputs or assumptions changes significantly, stock-based compensation expense may differ materially in the future from that recorded in the current period.
Recent Accounting Pronouncements
In May 2008, the Financial Accounting Standards Board (“FASB”) issued SFAS No. 162, The Hierarchy of Generally Accepted Accounting Principles. This statement identifies the sources of accounting principles and the framework for selecting the principles used in the preparation of financial statements of entities that are presented in conformity with generally accepted accounting principles (the GAAP hierarchy). SFAS No. 162 will become effective 60 days following the Securities and Exchange Commission’s approval of the Public Company Accounting Oversight Board amendments to AU Section 411, The Meaning of Present Fairly in Conformity With Generally Accepted Accounting Principles. We do not expect the adoption of SFAS No. 162 to have a material effect on our consolidated financial position, results of operations or cash flows.
In March 2008, the FASB issued SFAS No. 161, Disclosures about Derivative Instruments and Hedging Activities. This statement is intended to improve financial reporting about derivative instruments and hedging activities by requiring enhanced disclosures to enable investors to better understand their effects on an entity’s financial position, financial performance, and cash flows. The provisions of SFAS No. 161 are effective for the fiscal years and interim quarters beginning after November 15, 2008. We do not expect the adoption of this statement to have a material effect on our consolidated financial position, results of operations or cash flows.
In December 2007, the FASB issued SFAS No. 160, Noncontrolling Interests in Consolidated Financial Statements. This statement amends Accounting Research Bulletin No. 51, Consolidated Financial Statements, to establish accounting and reporting standards for the noncontrolling interest in a subsidiary and for the deconsolidation of a subsidiary. SFAS No. 160 is effective for fiscal years beginning after December 15, 2008. We do not expect the adoption of this statement to have a material effect on our consolidated financial position, results of operations or cash flows.
In December 2007, the FASB issued SFAS No. 141R, Business Combinations. This statement replaces SFAS No. 141 and requires the acquirer of a business to recognize and measure the identifiable assets acquired, the liabilities assumed, and any non-controlling interest in the acquiree at fair value. SFAS No. 141R also requires transaction costs related to the business combination to be expensed as incurred. SFAS No. 141R is effective for business combinations for which the acquisition date is on or after fiscal years beginning after December 15, 2008. We do not expect the adoption of this statement to have a material effect on our consolidated financial position, results of operations or cash flows.
37
In February 2007, the FASB issued SFAS No. 159, The Fair Value Option for Financial Assets and Financial Liabilities—including an amendment of FASB Statement No. 115. This statement permits us to measure many financial instruments and certain other assets and liabilities at fair value on an instrument-by-instrument basis. SFAS No. 159 is effective for fiscal years beginning after November 15, 2007. The adoption of this statement did not have a material effect on our consolidated financial position, results of operations or cash flows.
In September 2006, the FASB issued SFAS No. 157, Fair Value Measurements. SFAS No. 157 establishes a framework for measuring the fair value of assets and liabilities. This framework is intended to increase consistency in how fair value determinations are made under various existing accounting standards that permit, or in some cases require, estimates of fair market value. SFAS No. 157 also expands financial statement disclosure requirements about a company’s use of fair value measurements, including the effect of such measures on earnings. SFAS No. 157 is effective for fiscal years beginning after November 15, 2007, and interim periods within those fiscal years. The adoption of this statement did not have a material effect on our consolidated financial position, results of operations or cash flows. See Note 17 of Notes to Condensed Consolidated Financial Statements.
38
| Item 7A. | QUANTITATIVE AND QUALITATIVE DISCLOSURES ABOUT MARKET RISK |
The information required by this item is included in Management’s Discussion and Analysis of Financial Condition and Results of Operations and is incorporated herein by this reference.
| Item 8. | FINANCIAL STATEMENTS AND SUPPLEMENTARY DATA |
Our management is responsible for the information and representations contained in this report. The financial statements have been prepared in conformity with accounting principles generally accepted in the United States, which we consider appropriate in the circumstances and include some amounts based on our best estimates and judgments. Other financial information in this report is consistent with these financial statements.
Our accounting systems include controls designed to reasonably assure that assets are safeguarded from unauthorized use or disposition and which provide for the preparation of financial statements in conformity with accounting principles generally accepted in the United States of America. These systems are supplemented by the selection and training of qualified financial personnel and an organizational structure providing for appropriate segregation of duties.
The Audit Committee is responsible for recommending to the Board of Directors the appointment of the independent accountants and reviews with the independent accountants and management the scope and the results of the annual examination, the effectiveness of the accounting control system and other matters relating to our financial affairs as they deem appropriate.
39
REPORT OF INDEPENDENT REGISTERED PUBLIC ACCOUNTING FIRM
To the Board of Directors and Shareholders
Columbia Sportswear Company
Portland, Oregon
We have audited the accompanying consolidated balance sheets of Columbia Sportswear Company and subsidiaries (the “Company”) as of December 31, 2008 and 2007, and the related consolidated statements of operations, shareholders’ equity and cash flows for each of the three years in the period ended December 31, 2008. Our audits also included the consolidated financial statement schedule listed on the Index at Item 15. These financial statements and financial statement schedule are the responsibility of the Company’s management. Our responsibility is to express an opinion on these financial statements and financial statement schedule based on our audits.
We conducted our audits in accordance with the standards of the Public Company Accounting Oversight Board (United States). Those standards require that we plan and perform the audit to obtain reasonable assurance about whether the financial statements are free of material misstatement. An audit includes examining, on a test basis, evidence supporting the amounts and disclosures in the financial statements. An audit also includes assessing the accounting principles used and significant estimates made by management, as well as evaluating the overall financial statement presentation. We believe that our audits provide a reasonable basis for our opinion.
In our opinion, such consolidated financial statements present fairly, in all material respects, the financial position of the Company as of December 31, 2008 and 2007, and the results of its operations and its cash flows for each of the three years in the period ended December 31, 2008, in conformity with accounting principles generally accepted in the United States of America. Also, in our opinion, such financial statement schedule, when considered in relation to the basic consolidated financial statements taken as a whole, presents fairly, in all material respects, the information set forth therein.
We have also audited, in accordance with the standards of the Public Company Accounting Oversight Board (United States), the Company’s internal control over financial reporting as of December 31, 2008, based on the criteria established in Internal Control—Integrated Framework issued by the Committee of Sponsoring Organizations of the Treadway Commission and our report dated February 27, 2009, expressed an unqualified opinion on the Company’s internal control over financial reporting.
DELOITTE & TOUCHE LLP
Portland, Oregon
February 27, 2009
40
COLUMBIA SPORTSWEAR COMPANY
CONSOLIDATED BALANCE SHEETS
(In thousands)
| December 31, | ||||||
| 2008 | 2007 | |||||
| ASSETS | ||||||
| Current Assets: |
||||||
| Cash and cash equivalents |
$ | 230,617 | $ | 191,950 | ||
| Short-term investments |
22,433 | 81,598 | ||||
| Accounts receivable, net (Note 2) |
299,585 | 300,506 | ||||
| Inventories, net (Note 3) |
256,312 | 265,874 | ||||
| Deferred income taxes (Note 9) |
33,867 | 31,169 | ||||
| Prepaid expenses and other current assets |
29,705 | 14,567 | ||||
| Total current assets |
872,519 | 885,664 | ||||
| Property, plant, and equipment, net (Note 4) |
229,693 | 210,450 | ||||
| Intangibles and other non-current assets (Note 2) |
33,365 | 53,094 | ||||
| Goodwill (Note 2) |
12,659 | 17,273 | ||||
| Total assets |
$ | 1,148,236 | $ | 1,166,481 | ||
| LIABILITIES AND SHAREHOLDERS’ EQUITY | ||||||
| Current Liabilities: |
||||||
| Accounts payable |
$ | 104,354 | $ | 95,412 | ||
| Accrued liabilities (Note 6) |
58,085 | 62,549 | ||||
| Income taxes payable (Note 9) |
8,718 | 7,436 | ||||
| Deferred income taxes (Note 9) |
1,969 | 949 | ||||
| Other current liabilities (Note 7) |
63 | 185 | ||||
| Total current liabilities |
173,189 | 166,531 | ||||
| Income taxes payable (Note 9) |
20,412 | 18,663 | ||||
| Deferred income taxes (Note 9) |
— | 8,968 | ||||
| Other long-term liabilities (Note 7) |
10,545 | 2,198 | ||||
| Total liabilities |
204,146 | 196,360 | ||||
| Commitments and contingencies (Note 11) |
||||||
| Shareholders’ Equity: |
||||||
| Preferred stock; 10,000 shares authorized; none issued and outstanding |
— | — | ||||
| Common stock (no par value); 125,000 shares authorized; 33,865 and 35,824 issued and outstanding (Note 8) |
1,481 | 17,004 | ||||
| Retained earnings (Note 8) |
909,443 | 895,476 | ||||
| Accumulated other comprehensive income (Note 14) |
33,166 | 57,641 | ||||
| Total shareholders’ equity |
944,090 | 970,121 | ||||
| Total liabilities and shareholders’ equity |
$ | 1,148,236 | $ | 1,166,481 | ||
See accompanying notes to consolidated financial statements.
41
COLUMBIA SPORTSWEAR COMPANY
CONSOLIDATED STATEMENTS OF OPERATIONS
(In thousands, except per share amounts)
| Year Ended December 31, | ||||||||||||
| 2008 | 2007 | 2006 | ||||||||||
| Net sales |
$ | 1,317,835 | $ | 1,356,039 | $ | 1,287,672 | ||||||
| Cost of sales |
750,024 | 776,288 | 746,617 | |||||||||
| Gross profit |
567,811 | 579,751 | 541,055 | |||||||||
| Selling, general, and administrative expenses |
430,350 | 385,769 | 366,768 | |||||||||
| Impairment of acquired intangible assets (Note 2) |
24,742 | — | — | |||||||||
| Net licensing income |
5,987 | 5,157 | 5,486 | |||||||||
| Income from operations |
118,706 | 199,139 | 179,773 | |||||||||
| Interest income, net |
7,537 | 8,888 | 5,562 | |||||||||
| Income before income tax |
126,243 | 208,027 | 185,335 | |||||||||
| Income tax expense (Note 9) |
(31,196 | ) | (63,575 | ) | (62,317 | ) | ||||||
| Net income |
$ | 95,047 | $ | 144,452 | $ | 123,018 | ||||||
| Earnings per share: |
||||||||||||
| Basic |
$ | 2.75 | $ | 4.00 | $ | 3.39 | ||||||
| Diluted |
2.74 | 3.96 | 3.36 | |||||||||
| Cash dividends per share: |
$ | 0.64 | $ | 0.58 | $ | 0.14 | ||||||
| Weighted average shares outstanding (Note 13): |
||||||||||||
| Basic |
34,610 | 36,106 | 36,245 | |||||||||
| Diluted |
34,711 | 36,434 | 36,644 | |||||||||
See accompanying notes to consolidated financial statements.
42
COLUMBIA SPORTSWEAR COMPANY
CONSOLIDATED STATEMENTS OF CASH FLOWS
(In thousands)
| Year Ended December 31, | ||||||||||||
| 2008 | 2007 | 2006 | ||||||||||
| Cash flows from operating activities: |
||||||||||||
| Net income |
$ | 95,047 | $ | 144,452 | $ | 123,018 | ||||||
| Adjustments to reconcile net income to net cash provided by operating activities: |
||||||||||||
| Depreciation and amortization |
31,158 | 30,338 | 23,547 | |||||||||
| Loss on disposal of property, plant, and equipment |
253 | 237 | 705 | |||||||||
| Deferred income tax (benefit) expense |
(10,338 | ) | 278 | (2,429 | ) | |||||||
| Stock-based compensation |
6,302 | 7,260 | 10,120 | |||||||||
| Excess tax benefit from employee stock plans |
(72 | ) | (1,811 | ) | (2,148 | ) | ||||||
| Impairment of acquired intangibles |
24,742 | — | — | |||||||||
| Other |
— | — | 302 | |||||||||
| Changes in operating assets and liabilities: |
||||||||||||
| Accounts receivable |
(9,689 | ) | (3,093 | ) | 4,259 | |||||||
| Inventories |
4,507 | (46,010 | ) | (15,448 | ) | |||||||
| Prepaid expenses and other current assets |
(15,787 | ) | (1,355 | ) | (898 | ) | ||||||
| Intangibles and other assets |
101 | 592 | (905 | ) | ||||||||
| Accounts payable |
8,944 | 1,381 | 1,930 | |||||||||
| Accrued liabilities |
(1,047 | ) | (4,400 | ) | 3,323 | |||||||
| Income taxes payable |
2,567 | (5,665 | ) | 8,292 | ||||||||
| Other liabilities |
8,242 | 2,111 | (559 | ) | ||||||||
| Net cash provided by operating activities |
144,930 | 124,315 | 153,109 | |||||||||
| Cash flows from investing activities: |
||||||||||||
| Purchases of short-term investments |
(72,337 | ) | (305,769 | ) | (346,615 | ) | ||||||
| Sales of short-term investments |
131,565 | 379,460 | 350,520 | |||||||||
| Capital expenditures |
(47,580 | ) | (31,971 | ) | (47,465 | ) | ||||||
| Acquisitions, net of cash acquired |
— | — | (35,377 | ) | ||||||||
| Proceeds from sale of licenses |
— | — | 1,700 | |||||||||
| Proceeds from sale of property, plant, and equipment |
52 | 32 | 106 | |||||||||
| Net cash provided by (used in) investing activities |
11,700 | 41,752 | (77,131 | ) | ||||||||
| Cash flows from financing activities: |
||||||||||||
| Proceeds from notes payable |
33,727 | 30,651 | 43,585 | |||||||||
| Repayments on notes payable |
(33,727 | ) | (34,276 | ) | (86,531 | ) | ||||||
| Repayment on long-term debt and other long-term liabilities |
(21 | ) | (22 | ) | (13,759 | ) | ||||||
| Proceeds from issuance of common stock |
3,488 | 14,162 | 21,712 | |||||||||
| Excess tax benefit from employee stock plans |
72 | 1,811 | 2,148 | |||||||||
| Repurchase of common stock |
(83,865 | ) | (31,819 | ) | (75,490 | ) | ||||||
| Cash dividends paid |
(22,098 | ) | (20,915 | ) | (5,026 | ) | ||||||
| Net cash used in financing activities |
(102,424 | ) | (40,408 | ) | (113,361 | ) | ||||||
| Net effect of exchange rate changes on cash |
(15,539 | ) | 1,411 | 1,172 | ||||||||
| Net increase (decrease) in cash and cash equivalents |
38,667 | 127,070 | (36,211 | ) | ||||||||
| Cash and cash equivalents, beginning of year |
191,950 | 64,880 | 101,091 | |||||||||
| Cash and cash equivalents, end of year |
$ | 230,617 | $ | 191,950 | $ | 64,880 | ||||||
| Supplemental disclosures of cash flow information: |
||||||||||||
| Cash paid during the year for interest, net of capitalized interest |
$ | 47 | $ | 148 | $ | 1,329 | ||||||
| Cash paid during the year for income taxes |
48,521 | 73,293 | 58,651 | |||||||||
| Supplemental disclosures of non-cash investing activities: |
||||||||||||
| Capital expenditures incurred but not yet paid |
6,760 | 2,318 | 3,444 | |||||||||
| Supplemental disclosures of non-cash financing activities: |
||||||||||||
| Assumption of Montrail debt |
— | — | 5,833 | |||||||||
See accompanying notes to consolidated financial statements.
43
COLUMBIA SPORTSWEAR COMPANY
CONSOLIDATED STATEMENTS OF SHAREHOLDERS’ EQUITY
(In thousands)
| Common Stock | Retained Earnings |
Accumulated Other Comprehensive Income |
Comprehensive Income |
Total | |||||||||||||||||||
| Shares Outstanding |
Amount | ||||||||||||||||||||||
| BALANCE, JANUARY 1, 2006 |
36,863 | $ | 13,104 | $ | 704,724 | $ | 24,962 | $ | 742,790 | ||||||||||||||
| Components of comprehensive income: |
|||||||||||||||||||||||
| Net income |
— | — | 123,018 | — | $ | 123,018 | 123,018 | ||||||||||||||||
| Cash dividends ($0.14 per share) |
— | — | (5,026 | ) | — | — | (5,026 | ) | |||||||||||||||
| Foreign currency translation adjustment |
— | — | — | 11,167 | 11,167 | 11,167 | |||||||||||||||||
| Unrealized holding loss on derivative transactions, net |
— | — | — | (1,735 | ) | (1,735 | ) | (1,735 | ) | ||||||||||||||
| Comprehensive income |
— | — | — | — | $ | 132,450 | — | ||||||||||||||||
| Exercise of employee stock options |
682 | 21,712 | — | — | 21,712 | ||||||||||||||||||
| Tax benefit from stock plans |
— | 4,147 | — | — | 4,147 | ||||||||||||||||||
| Stock-based compensation expense |
— | 10,120 | — | — | 10,120 | ||||||||||||||||||
| Repurchase of common stock |
(1,547 | ) | (24,713 | ) | (50,777 | ) | — | (75,490 | ) | ||||||||||||||
| BALANCE, DECEMBER 31, 2006 |
35,998 | 24,370 | 771,939 | 34,394 | 830,703 | ||||||||||||||||||
| Components of comprehensive income: |
|||||||||||||||||||||||
| Net income |
— | — | 144,452 | — | $ | 144,452 | 144,452 | ||||||||||||||||
| Cash dividends ($0.58 per share) |
— | — | (20,915 | ) | — | — | (20,915 | ) | |||||||||||||||
| Foreign currency translation adjustment |
— | — | — | 25,394 | 25,394 | 25,394 | |||||||||||||||||
| Unrealized holding loss on derivative transactions, net |
— | — | — | (2,147 | ) | (2,147 | ) | (2,147 | ) | ||||||||||||||
| Comprehensive income |
— | — | — | — | $ | 167,699 | — | ||||||||||||||||
| Issuance of common stock under employee stock plans, net |
416 | 14,162 | — | — | 14,162 | ||||||||||||||||||
| Tax benefit from stock plans |
— | 3,031 | — | — | 3,031 | ||||||||||||||||||
| Stock-based compensation expense |
— | 7,260 | — | — | 7,260 | ||||||||||||||||||
| Repurchase of common stock |
(590 | ) | (31,819 | ) | — | — | (31,819 | ) | |||||||||||||||
| BALANCE, DECEMBER 31, 2007 |
35,824 | 17,004 | 895,476 | 57,641 | 970,121 | ||||||||||||||||||
| Components of comprehensive income: |
|||||||||||||||||||||||
| Net income |
— | — | 95,047 | — | $ | 95,047 | 95,047 | ||||||||||||||||
| Cash dividends ($0.64 per share) |
— | — | (22,098 | ) | — | — | (22,098 | ) | |||||||||||||||
| Foreign currency translation adjustment |
— | — | — | (30,511 | ) | (30,511 | ) | (30,511 | ) | ||||||||||||||
| Unrealized holding gain on derivative transactions, net |
— | — | — | 6,036 | 6,036 | 6,036 | |||||||||||||||||
| Comprehensive income |
— | — | — | — | $ | 70,572 | — | ||||||||||||||||
| Issuance of common stock under employee stock plans, net |
131 | 3,488 | — | — | 3,488 | ||||||||||||||||||
| Tax adjustment from stock plans |
— | (430 | ) | — | — | (430 | ) | ||||||||||||||||
| Stock-based compensation expense |
— | 6,302 | — | — | 6,302 | ||||||||||||||||||
| Repurchase of common stock |
(2,090 | ) | (24,883 | ) | (58,982 | ) | — | (83,865 | ) | ||||||||||||||
| BALANCE, DECEMBER 31, 2008 |
33,865 | $ | 1,481 | $ | 909,443 | $ | 33,166 | $ | 944,090 | ||||||||||||||
See accompanying notes to consolidated financial statements.
44
COLUMBIA SPORTSWEAR COMPANY
NOTES TO CONSOLIDATED FINANCIAL STATEMENTS
NOTE 1—BASIS OF PRESENTATION AND ORGANIZATION
Nature of the business:
Columbia Sportswear Company is a global leader in the design, manufacture, marketing and distribution of active outdoor apparel, including sportswear, outerwear, footwear, and related accessories and equipment.
Principles of consolidation:
The consolidated financial statements include the accounts of Columbia Sportswear Company and its wholly-owned subsidiaries (the “Company”). All significant intercompany balances and transactions have been eliminated in consolidation.
Estimates and assumptions:
The preparation of financial statements in conformity with accounting principles generally accepted in the United States of America requires management to make estimates and assumptions that affect the reported amounts of assets and liabilities and disclosure of contingent assets and liabilities at the date of the consolidated financial statements and the reported amounts of revenues and expenses during the reporting period. Actual results may differ from these estimates and assumptions. Some of these more significant estimates relate to revenue recognition, allowance for doubtful accounts, inventory, product warranty, intangible assets and income taxes.
Reclassifications:
Certain immaterial reclassifications of amounts reported in the prior period financial statements have been made to conform to classifications used in the current period financial statements.
Dependence on key suppliers:
The Company’s products are produced by independent manufacturers worldwide. For 2008, the Company sourced nearly all of its products outside the United States, principally in the Southeast Asia. The Company’s four largest factory groups accounted for approximately 11% of the Company’s total global production for 2008 and another company produced substantially all of the zippers used in the Company’s products. From time to time, the Company has had difficulty satisfying its raw material and finished goods requirements. Although the Company believes that it can identify and qualify additional raw material suppliers and manufacturers to produce these products, the unavailability of some existing suppliers or manufacturers for supply of these products may have a material adverse effect on the Company.
Concentration of credit risk:
Trade Receivables
At December 31, 2008, the Company had one customer in its EMEA segment and one customer in its Canadian segment that accounted for approximately 13.5% and 10.2% of consolidated accounts receivable, respectively. At December 31, 2007 the Company had one customer in its Canadian segment that accounted for approximately 12.4% of consolidated accounts receivable. No single customer accounted for greater than or equal to 10% of consolidated revenues for the year ended December 31, 2008 or 2007.
Derivatives
The Company routinely uses derivative instruments to hedge the foreign currency risk of anticipated transactions denominated in non-U.S. dollar currencies. At December 31, 2008, no contract had a remaining
45
COLUMBIA SPORTSWEAR COMPANY
NOTES TO CONSOLIDATED FINANCIAL STATEMENTS—(Continued)
maturity longer than one year. All the counterparties to these transactions had a Standard & Poor’s (“S&P”) / Moody’s Investor Services (“Moody’s”) short-term credit rating of A-2 / P-1 or better. The net exposure to any single counterparty, which is generally limited to the aggregate unrealized gain of all contracts with that counterparty, was immaterial at December 31, 2008.
Cash and Investments
At December 31, 2008, approximately 75% of the Company’s cash and cash equivalents were concentrated in domestic and international money market mutual funds. Substantially all of the Company’s money market mutual funds were assigned a triple A rating from S&P, Moody’s or Fitch Ratings.
On September 29, 2008, the U.S. Treasury Department announced a temporary guarantee program for money market mutual funds regulated under Rule 2a-7 of the Investment Company Act of 1940. The temporary guarantee program limits coverage to the lesser of fund balances at September 19, 2008 or fund balances immediately prior to an institution reporting a net asset value below $1 per share. On September 19, 2008, the Company had a total of approximately $50,000,000 of investments with two institutions qualifying for this guarantee program. At December 31, 2008, the eligible $50,000,000 remained invested and both institutions were actively participating in the guarantee program. The guarantee program is set to expire on April 30, 2009, but the U.S. Treasury Department could extend the program through September 18, 2009.
All the Company’s remaining cash and cash equivalents and short-term investments were deposited with various institutions in the Company’s primary operating geographies. All institutions were rated investment grade by both S&P and Moody’s and most were rated AA- / Aa1 or better.
NOTE 2—SUMMARY OF SIGNIFICANT ACCOUNTING POLICIES
Cash and cash equivalents:
Cash and cash equivalents are stated at cost, which approximates fair value, and include investments with maturities of three months or less from the date of acquisition. At December 31, 2008 and 2007, cash and cash equivalents were $230,617,000 and $191,950,000, respectively, primarily consisting of money market funds and certificates of deposit.
Short-term investments:
Short-term investments consist of debt security mutual fund shares available for use in current operations and certificates of deposit with maturities of six months or less at December 31, 2008. At December 31, 2007, short-term investments consisted of variable rate demand notes and obligations that generally mature up to 30 years from the purchase date. Investments with maturities beyond one year may be classified as short-term based on their highly liquid nature and because such marketable securities represent the investment of cash that is available for current operations. All short-term investments are classified as available-for-sale securities and are recorded at fair value with any unrealized gains and losses reported, net of tax, in other comprehensive income. Realized gains or losses are determined based on the specific identification method. The Company did not hold any auction-rate securities at December 31, 2008 or 2007 and had no investments considered to be trading or held-to-maturity securities.
Accounts receivable:
Accounts receivable have been reduced by an allowance for doubtful accounts. The Company makes ongoing estimates of the uncollectibility of accounts receivable and maintains an allowance for estimated losses resulting from the inability of the Company’s customers to make required payments. The allowance for doubtful accounts was $9,542,000 and $7,369,000 at December 31, 2008 and 2007, respectively.
46
COLUMBIA SPORTSWEAR COMPANY
NOTES TO CONSOLIDATED FINANCIAL STATEMENTS—(Continued)
Inventories:
Inventories are carried at the lower of cost or market. Cost is determined using the first-in, first-out method. The Company periodically reviews its inventories for excess, close-out or slow moving items and makes provisions as necessary to properly reflect inventory value.
Property, plant, and equipment:
Property, plant and equipment are stated at cost, net of accumulated depreciation. Depreciation is provided using the straight-line method over the estimated useful lives of the assets. The principal estimated useful lives are: buildings and building improvements, 15-30 years; land improvements, 15 years; furniture and fixtures, 3-10 years; and machinery and equipment, 3-5 years. Leasehold improvements are depreciated over the lesser of the estimated useful life of the improvement, which is most commonly 7 years, or the remaining term of the underlying lease.
The interest-carrying costs of capital assets under construction are capitalized based on the Company’s weighted average borrowing rates if there are any outstanding borrowings. There was no capitalized interest for the years ended December 31, 2008 and 2007 and capitalized interest was $642,000 for the year ended December 31, 2006.
Intangible assets:
Intangible assets with indefinite useful lives are not amortized and are periodically evaluated for impairment. Intangible assets that are determined to have finite lives are amortized using the straight-line method over their useful lives.
The following table summarizes the Company’s identifiable intangible assets balance (in thousands):
| December 31, 2008 | December 31, 2007 | |||||||||||||
| Carrying Amount |
Accumulated Amortization |
Carrying Amount |
Accumulated Amortization |
|||||||||||
| Intangible assets subject to amortization: |
||||||||||||||
| Patents |
$ | 898 | $ | (534 | ) | $ | 1,603 | $ | (556 | ) | ||||
| Intangible assets not subject to amortization: |
||||||||||||||
| Trademarks and trade names |
$ | 26,872 | $ | 46,771 | ||||||||||
| Goodwill |
12,659 | 17,273 | ||||||||||||
| $ | 39,531 | $ | 64,044 | |||||||||||
Patents are subject to amortization over the lesser of 17 years from the date filed with the U.S. Patent and Trademark Office or the estimated useful life of the patent. Amortization expense for the years ended December 31, 2008, 2007, and 2006 was $205,000, $175,000 and $150,000, respectively. Amortization expense for intangible assets subject to amortization is estimated to be $109,000 per year in 2009 and 2010 and $73,000 per year in 2011 and 2012. These patents are anticipated to become fully amortized during 2012.
Other non-current assets totaled $6,129,000 and $5,276,000 at December 31, 2008 and 2007, respectively.
Impairment of long-lived and intangible assets:
Goodwill and intangible assets with indefinite useful lives are not amortized but instead are measured for impairment in accordance with Statement of Financial Accounting Standards (“SFAS”) No. 142, Goodwill and Other Intangible Assets. The Company reviews and tests its goodwill and intangible assets with indefinite useful
47
COLUMBIA SPORTSWEAR COMPANY
NOTES TO CONSOLIDATED FINANCIAL STATEMENTS—(Continued)
lives for impairment in the fourth quarter of each year and when events or changes in circumstances indicate that the carrying amount of such assets may be impaired. The Company’s intangible assets with indefinite lives consist of trademarks. Impairment testing for goodwill is performed at the reporting unit level. The two-step process first compares the estimated fair value of reporting unit goodwill with the carrying amount of that reporting unit. The Company estimates the fair value of its reporting units using a combination of discounted cash flow analysis, comparisons with the market values of similar publicly traded companies and other operating performance based valuation methods. If step one indicates impairment, step two compares the estimated fair value of the reporting unit to the estimated fair value of all reporting unit assets and liabilities except goodwill to determine the implied fair value of goodwill. The Company calculates impairment as the excess of carrying amount of goodwill over the implied fair value of goodwill. In the impairment test for trademarks, the Company compares the estimated fair value of the asset to the carrying amount. The fair value of trademarks is estimated using the relief from royalty approach, a standard form of discounted cash flow analysis used in the valuation of trademarks. If the carrying amount of trademarks exceeds the estimated fair value, the Company calculates impairment as the excess of carrying amount over the estimate of fair value. Impairment charges are classified as a separate component of operating expense. The fair value estimates are based on a number of factors, including assumptions and estimates for projected sales, income, cash flows, discount rates and other operating performance measures. Changes in estimates or the application of alternative assumptions could produce significantly different results. These assumptions and estimates may change in the future due to changes in economic conditions, changes in the Company’s ability to meet sales and profitability objectives or changes in the Company’s business operations or strategic direction.
The Company determined that its Pacific Trail brand and Montrail brand goodwill and trademarks were impaired at December 31, 2008. These brands have not achieved their sales and profitability objectives. The deterioration in the macroeconomic environment and the resulting effect on consumer demand has decreased the probability of realizing these objectives in the near future. These brands were acquired in 2006. The Company has recorded impairment charges, before income taxes, of $12,250,000 in trademarks and $3,900,000 in goodwill for the Pacific Trail brand. The Pacific Trail brand has $2,300,000 in trademarks and no goodwill after the impairment charge. The Pacific Trail brand is a reporting unit for goodwill impairment testing and Pacific Trail brand intangible assets are included in the United States segment. The Company has recorded impairment charges, before income taxes, of $7,400,000 in trademarks and $714,000 in goodwill for Montrail brand. The Montrail brand has $2,600,000 in trademarks and no goodwill after the impairment charge. The Montrail brand is a reporting unit for goodwill impairment testing and Montrail brand intangible assets are included in the United States segment.
Other than Montrail brand goodwill and trademarks and Pacific Trail brand goodwill and trademarks at December 31, 2008, the Company has determined that its goodwill and intangible assets with indefinite lives at December 31, 2008 and 2007 were not impaired.
Long-lived and intangible assets that are determined to have finite lives are amortized over their useful lives and are measured for impairment only when events or circumstances indicate the carrying value may be impaired. In these cases, the Company estimates the future undiscounted cash flows to be derived from the asset or asset group to determine whether a potential impairment exists. If the carrying value exceeds the estimate of future undiscounted cash flows, the Company then calculates the impairment as the excess of the carrying value of the asset over the estimate of its fair value. Impairment charges are classified as a separate component of operating expense.
The Company has determined that a Montrail brand patent was impaired at December 31, 2008. There is no anticipated future use of the patent beyond 2009, resulting in an impairment charge, before income taxes, of $478,000. The Montrail brand patent was included in the United States segment and was acquired in 2006.
48
COLUMBIA SPORTSWEAR COMPANY
NOTES TO CONSOLIDATED FINANCIAL STATEMENTS—(Continued)
Other than the Montrail brand patent, the Company has determined that its long-lived and intangible assets that are determined to have finite lives at December 31, 2008 and 2007 were not impaired.
Deferred income taxes:
Income tax expense is provided at the U.S. tax rate on financial statement earnings, adjusted for the difference between the U.S. tax rate and the rate of tax in effect for non-U.S. earnings deemed to be permanently reinvested in the Company’s non-U.S. operations. Deferred income taxes have not been provided for the potential remittance of non-U.S. undistributed earnings to the extent those earnings are deemed to be permanently reinvested, or to the extent such recognition would result in a deferred tax asset. Deferred income taxes are provided for the expected tax consequences of temporary differences between the tax bases of assets and liabilities and their reported amounts. Valuation allowances are recorded to reduce deferred tax assets to the amount that will more likely than not be realized.
In July 2006, the Financial Accounting Standards Board (“FASB”) issued Financial Accounting Standards Interpretation No. 48 (“FIN 48”), Accounting for Uncertainty in Income Taxes—an interpretation of FASB Statement No. 109. FIN 48 creates a single model to address accounting for uncertainty in tax positions and clarifies the accounting for income taxes, by prescribing a minimum recognition threshold a tax position is required to meet before being recognized in the financial statements. FIN 48 also provides guidance on derecognition, measurement, classification, interest and penalties, accounting in interim periods, disclosure, and transition. The Company adopted the provisions of FIN 48 on January 1, 2007 which did not result in the recognition of a material adjustment in the liability for unrecognized tax benefits.
Revenue Recognition:
The Company records wholesale and licensed product revenues when title passes and the risks and rewards of ownership have passed to the customer, based on the terms of sale. Title generally passes upon shipment or upon receipt by the customer depending on the country of the sale and the agreement with the customer. Retail store revenues are recorded at the time of sale.
In some countries outside of the United States where title passes upon receipt by the customer, predominantly where the Company sells direct in Western Europe, precise information regarding the date of receipt by the customer is not readily available. In these cases, the Company estimates the date of receipt by the customer based on historical and expected delivery times by geographic location. The Company periodically tests the accuracy of these estimates based on actual transactions. Delivery times vary by geographic location, generally from one to five days. The Company periodically tests the accuracy of these estimates based on actual transactions. To date, the Company has found these estimates to be materially accurate.
At the time of revenue recognition, the Company also provides for estimated sales returns and miscellaneous claims from customers as reductions to revenues. The estimates are based on historical rates of product returns and claims. However, actual returns and claims in any future period are inherently uncertain and thus may differ from the estimates. If actual or expected future returns and claims are significantly greater or lower than the reserves that had been established, the Company would record a reduction or increase to net revenues in the period in which it made such determination. Over the three year period ended December 31, 2008, the Company’s actual annual sales returns and miscellaneous claims from customers were approximately two percent of net sales. The allowance for outstanding sales returns and miscellaneous claims from customers was approximately $10,583,000 and $9,196,000 as of December 31, 2008 and 2007, respectively.
49
COLUMBIA SPORTSWEAR COMPANY
NOTES TO CONSOLIDATED FINANCIAL STATEMENTS—(Continued)
Cost of sales:
The expenses that are included in cost of sales include all direct product and conversion-related costs, and costs related to shipping, duties and importation. Product warranty costs and specific provisions for excess, close-out or slow moving inventory are also included in cost of sales.
Selling, general and administrative expense:
Selling, general and administrative expense consists of commissions, advertising, other selling costs, personnel-related costs, planning, receiving finished goods, warehousing, depreciation and other general operating expenses.
Shipping and handling costs:
Shipping and handling fees billed to customers are recorded as revenue. The direct costs associated with shipping goods to customers are recorded as cost of sales. Inventory planning, receiving and handling costs are recorded as a component of selling, general, and administrative expenses and were $57,700,000, $64,420,000 and $50,213,000 for the years ended December 31, 2008, 2007 and 2006, respectively.
Foreign currency translation:
The assets and liabilities of the Company’s foreign subsidiaries have been translated into U.S. dollars using the exchange rates in effect at period end, and the net sales and expenses have been translated into U.S. dollars using average exchange rates in effect during the period. The foreign currency translation adjustments are included as a separate component of accumulated other comprehensive income (loss) in shareholders’ equity and are not currently adjusted for income taxes when they relate to indefinite net investments in non-U.S. operations.
Fair value of financial instruments:
Based on borrowing rates currently available to the Company for bank loans with similar terms and maturities, the fair value of the Company’s other long-term liabilities approximates the carrying value. Furthermore, the carrying value of all other financial instruments potentially subject to valuation risk (principally consisting of cash and cash equivalents, short-term investments, accounts receivable and accounts payable) also approximate fair value because of their short-term maturities.
Derivatives:
The Company accounts for derivatives in accordance with SFAS No. 133, Accounting for Derivative Instruments and Hedging Activities, as amended.
Substantially all foreign currency derivatives entered into by the Company qualify for and are designated as foreign currency cash flow hedges, including those hedging foreign currency denominated firm commitments. Changes in fair values of outstanding cash flow hedges are recorded in other comprehensive income, until earnings are affected by the hedged transaction. In most cases amounts recorded in other comprehensive income will be released to earnings some time after maturity of the related derivative. The Consolidated Statement of Operations classification of effective hedge results is the same as that of the underlying exposure. Results of hedges of product costs are recorded in cost of sales when the underlying hedged transaction affects earnings. Unrealized derivative gains and losses, which are recorded in current assets and liabilities, respectively, are non-cash items and therefore are taken into account in the preparation of the Consolidated Statement of Cash Flows based on their respective balance sheet classifications.
50
COLUMBIA SPORTSWEAR COMPANY
NOTES TO CONSOLIDATED FINANCIAL STATEMENTS—(Continued)
Stock-based compensation:
The Company accounts for stock-based compensation in accordance with SFAS No. 123(R), Share-Based Payment. Under the provisions of SFAS No. 123R, stock-based compensation cost is estimated at the grant date based on the award’s fair value and is recognized as expense over the requisite service period using the straight-line attribution method. As allowed under SFAS No. 123R, the Company estimates stock-based compensation at the stock option grant date using the Black-Scholes option pricing model, which requires various highly subjective assumptions, including volatility and expected option life. Further, as required under SFAS No. 123R, the Company estimates forfeitures for stock-based awards granted, which are not expected to vest. If any of these inputs or assumptions changes significantly, stock-based compensation expense may differ materially in the future from that recorded in the current period.
Advertising costs:
Advertising costs are expensed in the period incurred and are included in selling, general and administrative expenses. Total advertising expense, including cooperative advertising costs, was $72,237,000, $55,290,000 and $56,813,000 for the years ended December 31, 2008, 2007 and 2006, respectively.
Through cooperative advertising programs, the Company reimburses its wholesale customers for some of their costs of advertising the Company’s products based on various criteria, including the value of purchases from the Company and various advertising specifications. Cooperative advertising costs are included in expenses because the Company receives an identifiable benefit in exchange for the cost, the advertising may be obtained from a party other than the customer, and the fair value of the advertising benefit can be reasonably estimated. Cooperative advertising costs were $16,351,000, $17,884,000 and $16,942,000 for the years ended December 31, 2008, 2007 and 2006, respectively.
Product warranty:
Some of the Company’s products carry limited warranty provisions for defects in quality and workmanship. A warranty reserve is established at the time of sale to cover estimated costs based on the Company’s history of warranty repairs and replacements and is recorded in cost of sales. The reserve for warranty claims at December 31, 2008 and 2007 was $9,746,000 and $10,862,000, respectively.
Recent Accounting Pronouncements:
In May 2008, the FASB issued SFAS No. 162, The Hierarchy of Generally Accepted Accounting Principles. This statement identifies the sources of accounting principles and the framework for selecting the principles used in the preparation of financial statements of entities that are presented in conformity with generally accepted accounting principles (the GAAP hierarchy). SFAS No. 162 will become effective 60 days following the Securities and Exchange Commission’s approval of the Public Company Accounting Oversight Board amendments to AU Section 411, The Meaning of Present Fairly in Conformity With Generally Accepted Accounting Principles. The Company does not expect the adoption of SFAS No. 162 to have a material effect on its consolidated financial position, results of operations or cash flows.
In March 2008, the FASB issued SFAS No. 161, Disclosures About Derivative Instruments and Hedging Activities. This statement is intended to improve financial reporting about derivative instruments and hedging activities by requiring enhanced disclosures to enable investors to better understand their effects on an entity’s financial position, financial performance and cash flows. The provisions of SFAS No. 161 are effective for the fiscal years and interim quarters beginning after November 15, 2008. The Company does not expect the adoption of this statement to have a material effect on its consolidated financial position, results of operations or cash flows.
51
COLUMBIA SPORTSWEAR COMPANY
NOTES TO CONSOLIDATED FINANCIAL STATEMENTS—(Continued)
In December 2007, the FASB issued SFAS No. 160, Noncontrolling Interests in Consolidated Financial Statements. This statement amends Accounting Research Bulletin No. 51, Consolidated Financial Statements, to establish accounting and reporting standards for the noncontrolling interest in a subsidiary and for the deconsolidation of a subsidiary. SFAS No. 160 is effective for fiscal years beginning after December 15, 2008. The Company does not expect the adoption of this statement to have a material effect on its consolidated financial position, results of operations or cash flows.
In December 2007, the FASB issued SFAS No. 141R, Business Combinations. This statement replaces SFAS No. 141 and requires the acquirer of a business to recognize and measure the identifiable assets acquired, the liabilities assumed, and any non-controlling interest in the acquiree at fair value. SFAS No. 141R also requires transaction costs related to the business combination to be expensed as incurred. SFAS No. 141R is effective for business combinations for which the acquisition date is on or after fiscal years beginning after December 15, 2008. The Company does not expect the adoption of this statement to have a material effect on its consolidated financial position, results of operations or cash flows.
In February 2007, the FASB issued SFAS No. 159, The Fair Value Option for Financial Assets and Financial Liabilities—including an amendment of FASB Statement No. 115. This statement permits an entity to measure many financial instruments and certain other assets and liabilities at fair value on an instrument-by-instrument basis. SFAS No. 159 is effective for fiscal years beginning after November 15, 2007. The adoption of this statement did not have a material effect on the Company’s consolidated financial position, results of operations or cash flows.
In September 2006, the FASB issued SFAS No. 157, Fair Value Measurements. SFAS No. 157 establishes a framework for measuring the fair value of assets and liabilities. This framework is intended to increase consistency in how fair value determinations are made under various existing accounting standards that permit, or in some cases require, estimates of fair market value. SFAS No. 157 also expands financial statement disclosure requirements about a company’s use of fair value measurements, including the effect of such measures on earnings. SFAS No. 157 is effective for fiscal years beginning after November 15, 2007, and interim periods within those fiscal years. The adoption of this statement did not have a material effect on the Company’s consolidated financial position, results of operations or cash flows. See Note 17.
NOTE 3—INVENTORIES, NET
Inventories consist of the following (in thousands):
| December 31, | ||||||
| 2008 | 2007 | |||||
| Raw materials |
$ | 621 | $ | 392 | ||
| Work in process |
1,065 | 3,979 | ||||
| Finished goods |
254,626 | 261,503 | ||||
| $ | 256,312 | $ | 265,874 | |||
52
COLUMBIA SPORTSWEAR COMPANY
NOTES TO CONSOLIDATED FINANCIAL STATEMENTS—(Continued)
NOTE 4—PROPERTY, PLANT, AND EQUIPMENT, NET
Property, plant, and equipment consist of the following (in thousands):
| December 31, | ||||||
| 2008 | 2007 | |||||
| Land and improvements |
$ | 16,465 | $ | 16,602 | ||
| Building and improvements |
143,997 | 140,602 | ||||
| Machinery and equipment |
171,091 | 165,504 | ||||
| Furniture and fixtures |
37,886 | 29,365 | ||||
| Leasehold improvements |
45,231 | 20,632 | ||||
| Construction in progress |
5,929 | 5,812 | ||||
| 420,599 | 378,517 | |||||
| Less accumulated depreciation |
190,906 | 168,067 | ||||
| $ | 229,693 | $ | 210,450 | |||
NOTE 5—SHORT-TERM BORROWINGS AND CREDIT LINES
The Company has available an unsecured and committed revolving line of credit providing for borrowings in an aggregate amount not to exceed, at any time, $100,000,000 during the period of August 15 through November 14 and $25,000,000 at all other times. The maturity date of this agreement is July 1, 2010. Interest, payable monthly, is computed at the bank’s prime rate minus 195 to 205 basis points per annum or the LIBOR rate plus 45 to 65 basis points. The unsecured revolving line of credit requires the Company to comply with certain covenants including a Capital Ratio, which limits indebtedness to tangible net worth. At December 31, 2008, the Company was in compliance with all of these covenants. If the Company defaults on its payments, it is prohibited, subject to certain exceptions, from making dividend payments or other distributions. The Company also has available an unsecured and uncommitted revolving line of credit providing for borrowing to a maximum of $25,000,000. The revolving line accrues interest on the LIBOR plus 65 basis points. There were no balances outstanding under either of these lines at December 31, 2008 and 2007.
The Company’s Canadian subsidiary has available an unsecured and uncommitted line of credit guaranteed by the parent company providing for borrowing to a maximum of C$30,000,000 (US$24,614,000) at December 31, 2008. The revolving line accrues interest at the bank’s Canadian prime rate. There was no balance outstanding under this line at December 31, 2008 and 2007.
The Company’s European subsidiary has available two separate unsecured and uncommitted lines of credit guaranteed by the parent company providing for borrowing to a maximum of 30,000,000 and 20,000,000 euros respectively (combined US$69,850,000) at December 31, 2008, of which US$3,493,000 of the 20,000,000 euro line is designated as a European customs guarantee. These lines accrue interest based on the ECB refinancing rate plus 50 basis points and EURIBOR plus 50 basis points, respectively. There was no balance outstanding under either line at December 31, 2008 and 2007.
The Company’s Japanese subsidiary has an unsecured and uncommitted line of credit guaranteed by the parent company providing for borrowing to a maximum of 1,000,000,000 JPY (US$11,033,000) at December 31, 2008. The revolving line accrues interest at the bank’s Best Lending Rate or the LIBOR rate plus 110 basis points. There was no balance outstanding under this line at December 31, 2008 and 2007.
53
COLUMBIA SPORTSWEAR COMPANY
NOTES TO CONSOLIDATED FINANCIAL STATEMENTS—(Continued)
The Company’s Korean subsidiary also has an unsecured and uncommitted line of credit guaranteed by the parent company providing for borrowing to a maximum of US$10,000,000 at December 31, 2008. The revolving line accrues interest at the three month certificate of deposit rate plus 1.3%. There was no balance outstanding under this line at December 31, 2008 and 2007.
Off-Balance Sheet Arrangements
The Company has arrangements in place to facilitate the import and purchase of inventory through the issuance of sight letters of credit. The Company has available an unsecured and uncommitted $50,000,000 import letter of credit line subject to annual renewal. At December 31, 2008, the Company had outstanding letters of credit of $8,338,000 for purchase orders for inventory under this arrangement. The Company also has available an unsecured and uncommitted $100,000,000 import letter of credit line subject to annual renewal. At December 31, 2008, the Company did not have any outstanding letters of credit for purchase orders for inventory under this arrangement.
NOTE 6—ACCRUED LIABILITIES
Accrued liabilities consist of the following (in thousands):
| December 31, | ||||||
| 2008 | 2007 | |||||
| Accrued salaries, bonus, vacation and other benefits |
$ | 29,437 | $ | 34,952 | ||
| Accrued product warranty |
9,746 | 10,862 | ||||
| Accrued cooperative advertising |
6,457 | 6,877 | ||||
| Other |
12,445 | 9,858 | ||||
| $ | 58,085 | $ | 62,549 | |||
NOTE 7—OTHER LONG-TERM LIABILITIES
Other long-term liabilities consist of installment purchase obligations for non-inventory purchases made in the ordinary course of business, long-term severance liabilities, deferred rent obligations, the effect of straight-line rent under various operating leases, and rental asset retirement obligations. Deferred rent, straight-line rent, and rental asset retirement obligation liabilities were $10,126,000 and $2,137,000 at December 31, 2008 and 2007, respectively. The corresponding lease obligations for these deferred and straight-line rent liabilities are disclosed in Note 11. Principal payments due on installment purchase obligations are $63,000 in 2009 and $15,000 in 2010.
NOTE 8—SHAREHOLDERS’ EQUITY
Since the inception of the Company’s stock repurchase plan in 2004 through December 31, 2008, the Company’s Board of Directors has authorized the repurchase of $500,000,000 of the Company’s common stock. As of December 31, 2008, the Company has repurchased 8,694,657 shares under this program at an aggregate purchase price of approximately $400,000,000. During the year ended December 31, 2008, the Company repurchased an aggregate of $83,865,000 of the Company’s common stock under the stock repurchase plan, of which $58,982,000 was recorded as a reduction to total retained earnings; otherwise, the aggregate purchase price would have resulted in a negative common stock carrying amount. Shares of the Company’s common stock may be purchased in the open market or through privately negotiated transactions, subject to the market conditions. The repurchase program does not obligate the Company to acquire any specific number of shares or to acquire shares over any specified period of time.
54
COLUMBIA SPORTSWEAR COMPANY
NOTES TO CONSOLIDATED FINANCIAL STATEMENTS—(Continued)
NOTE 9—INCOME TAXES
The Company applies an asset and liability method of accounting for income taxes that requires the recognition of deferred tax assets and liabilities for the expected future tax consequences of events that have been recognized in the Company’s financial statements or tax returns. In estimating future tax consequences, the Company generally considers all expected future events other than enactment of changes in the tax laws or rates. Deferred taxes are provided for temporary differences between assets and liabilities for financial reporting purposes and for income tax purposes. Valuation allowances are recorded against net deferred tax assets when it is more likely than not that the asset will not be realized.
The Company had undistributed earnings of foreign subsidiaries of approximately $135,918,000 at December 31, 2008 for which deferred taxes have not been provided. Such earnings are considered indefinitely invested outside of the United States. If these earnings were repatriated to the United States, the earnings would be subject to U.S. taxation. The amount of the unrecognized deferred tax liability associated with the undistributed earnings was approximately $32,237,000 at December 31, 2008. The unrecognized deferred tax liability approximates the excess of the United States tax liability over the creditable foreign taxes paid that would result from a full remittance of undistributed earnings.
The Company adopted the provisions of FIN 48 on January 1, 2007. The Company did not recognize a material adjustment in the liability for unrecognized tax benefits as a result of the implementation of FIN 48. A reconciliation of the beginning and ending amount of gross unrecognized tax benefits is as follows (in thousands):
| December 31, | ||||||||
| 2008 | 2007 | |||||||
| Balance at January 1 |
$ | 20,694 | $ | 19,705 | ||||
| Increases related to prior year tax positions |
583 | 1,148 | ||||||
| Decreases related to prior year tax positions |
(2,496 | ) | (4,272 | ) | ||||
| Increases related to current year tax positions |
4,768 | 5,284 | ||||||
| Settlements |
— | (1,117 | ) | |||||
| Lapses of statute of limitations |
(1,710 | ) | (54 | ) | ||||
| Balance at December 31 |
$ | 21,839 | $ | 20,694 | ||||
$20,096,000 and $19,002,000 of the unrecognized tax benefits balance would affect the effective tax rate if recognized at December 31, 2008 and 2007, respectively. In 2007, approximately $853,000 of gross increases and decreases from current year tax positions and $2,056,000 of gross increases and decreases from prior year tax positions have been presented on a net basis in the tabular unrecognized tax benefits reconciliation. These unrecognized tax benefits were a result of changes in estimates during the year relating to a European tax examination which was effectively settled in the fourth quarter of 2007.
The Company conducts business globally, and as a result, the Company or one or more of its subsidiaries files income tax returns in the U.S. federal jurisdiction and various state and foreign jurisdictions. The Company is subject to examination by taxing authorities throughout the world, including such major jurisdictions as Canada, China, France, Germany, Hong Kong, Italy, Japan, South Korea, Switzerland, the United Kingdom and the United States. The Company has effectively settled U.S. tax examinations of all years through 2005. Internationally, the Company has effectively settled French tax examinations of all years through 2006 and Italian tax examinations of all years through 2007. The Company is currently under examination in Canada for the tax years 2002 through 2004. The Company does not anticipate that adjustments relative to this ongoing tax audit will result in a material change to its consolidated financial position, results of operations or cash flows.
55
COLUMBIA SPORTSWEAR COMPANY
NOTES TO CONSOLIDATED FINANCIAL STATEMENTS—(Continued)
Due to the potential for resolution of income tax audits currently in progress, and the expiration of various statutes of limitation, it is reasonably possible that the unrecognized tax benefits balance may change within the twelve months from December 31, 2008 by a range of zero to $8,645,000. At December 31, 2007, the comparable range was zero to $6,674,000. Open tax years, including those previously mentioned, contain matters that could be subject to differing interpretations of applicable tax laws and regulations as they relate to the amount, timing, or inclusion of revenue and expenses or the sustainability of income tax credits for a given examination cycle.
The Company recognizes interest expense and penalties related to income tax matters in income tax expense. The Company recognized interest and penalties related to uncertain tax positions during 2008 of $313,000 and the Company recognized a net reversal of accrued interest and penalties of $117,000 during 2007. The Company had $3,234,000 and $2,922,000 of accrued interest and penalties related to uncertain tax positions at December 31, 2008 and 2007, respectively.
Consolidated income from continuing operations before income taxes consists of the following (in thousands):
| Year Ended December 31, | |||||||||
| 2008 | 2007 | 2006 | |||||||
| U.S. operations |
$ | 44,478 | $ | 122,588 | $ | 114,027 | |||
| Foreign operations |
81,765 | 85,439 | 71,308 | ||||||
| Income before income tax |
$ | 126,243 | $ | 208,027 | $ | 185,335 | |||
The components of the provision (benefit) for income taxes consist of the following (in thousands):
| Year Ended December 31, | ||||||||||||
| 2008 | 2007 | 2006 | ||||||||||
| Current: |
||||||||||||
| Federal |
$ | 22,576 | $ | 40,490 | $ | 48,181 | ||||||
| State and local |
2,459 | 3,685 | 3,316 | |||||||||
| Non-U.S. |
18,568 | 22,493 | 16,494 | |||||||||
| 43,603 | 66,668 | 67,991 | ||||||||||
| Deferred: |
||||||||||||
| Federal |
(10,444 | ) | (2,726 | ) | (3,490 | ) | ||||||
| State and local |
(1,228 | ) | (222 | ) | (93 | ) | ||||||
| Non-U.S. |
(735 | ) | (145 | ) | (2,091 | ) | ||||||
| (12,407 | ) | (3,093 | ) | (5,674 | ) | |||||||
| Income tax expense |
$ | 31,196 | $ | 63,575 | $ | 62,317 | ||||||
56
COLUMBIA SPORTSWEAR COMPANY
NOTES TO CONSOLIDATED FINANCIAL STATEMENTS—(Continued)
The following is a reconciliation of the normal expected statutory federal income tax rate to the effective rate reported in the financial statements:
| Year Ended December 31, | |||||||||
| 2008 | 2007 | 2006 | |||||||
| (percent of income) | |||||||||
| Provision for federal income taxes at the statutory rate |
35.0 | % | 35.0 | % | 35.0 | % | |||
| State and local income taxes, net of federal benefit |
0.8 | 1.1 | 1.2 | ||||||
| Non-U.S. income taxed at different rates |
(4.1 | ) | (1.4 | ) | (1.6 | ) | |||
| Foreign tax credits |
(3.2 | ) | — | — | |||||
| Reduction of accrued income taxes |
(3.3 | ) | (2.8 | ) | — | ||||
| Tax-exempt interest |
(0.8 | ) | (1.0 | ) | (1.0 | ) | |||
| Other |
0.3 | (0.3 | ) | — | |||||
| Actual provision for income taxes |
24.7 | % | 30.6 | % | 33.6 | % | |||
Significant components of the Company’s deferred taxes are as follows (in thousands):
| December 31, | ||||||||
| 2008 | 2007 | |||||||
| Deferred tax assets: |
||||||||
| Non-deductible accruals and allowances |
$ | 14,886 | $ | 12,630 | ||||
| Capitalized inventory costs |
14,703 | 14,411 | ||||||
| Stock compensation |
4,857 | 3,835 | ||||||
| Net operating loss carryforward |
2,130 | 1,400 | ||||||
| Depreciation and amortization |
972 | 420 | ||||||
| Other |
1,747 | 1,130 | ||||||
| 39,295 | 33,826 | |||||||
| Valuation allowance |
(2,512 | ) | (889 | ) | ||||
| Net deferred tax assets |
36,783 | 32,937 | ||||||
| Deferred tax liabilities: |
||||||||
| Deductible accruals and allowance |
(1,396 | ) | (961 | ) | ||||
| Depreciation and amortization |
— | (4,677 | ) | |||||
| Foreign currency gain (loss) |
(2,022 | ) | (4,810 | ) | ||||
| Other |
(744 | ) | (793 | ) | ||||
| (4,162 | ) | (11,241 | ) | |||||
| Total |
$ | 32,621 | $ | 21,696 | ||||
The Company had net operating loss carryforwards at December 31, 2008 and December 31, 2007 in certain international tax jurisdictions of $27,191,000 and $19,000,000, respectively which will begin to expire in 2014. The net operating losses result in a deferred tax asset at December 31, 2008 of $2,130,000 which was subject to a $2,130,000 valuation allowance and a deferred tax asset at December 31, 2007 of $1,400,000 which was subject to a $460,000 valuation allowance. To the extent that the Company reverses a portion of the valuation allowance, the adjustment would be recorded as a reduction to income tax expense.
Non-current deferred tax assets of $723,000 and $444,000 are included as a component of other assets in the consolidated balance sheet at December 31, 2008 and 2007, respectively.
57
COLUMBIA SPORTSWEAR COMPANY
NOTES TO CONSOLIDATED FINANCIAL STATEMENTS—(Continued)
NOTE 10—PROFIT SHARING PLAN
The Company has a 401(k) profit-sharing plan, which covers substantially all U.S. employees. Participation begins the first of the quarter following completion of thirty days of service. The Company may elect to make discretionary matching and/or non-matching contributions. All Company contributions to the plan as determined by the Board of Directors totaled $3,118,000, $5,083,000 and $4,937,000 for the years ended December 31, 2008, 2007 and 2006, respectively.
NOTE 11—COMMITMENTS AND CONTINGENCIES
Operating Leases
The Company leases, among other things, retail space, office space, warehouse facilities, storage space, vehicles and equipment. Generally, the base lease terms are between 5 and 10 years. Certain lease agreements contain scheduled rent escalation clauses in their future minimum lease payments. Future minimum lease payments are recognized on a straight-line basis over the minimum lease term and the pro rata portion of scheduled rent escalations is included in other long-term liabilities in the Consolidated Balance Sheet. Certain retail space lease agreements provide for additional rents based on a percentage of annual sales in excess of stipulated minimums (percentage rent). Certain retail space lease agreements require the Company to pay real estate taxes, insurance, common area maintenance (“CAM”), and other costs, collectively referred to as operating costs, in addition to base rent. Percentage rent and operating costs are recognized as incurred in SG&A expense in the Consolidated Statement of Operations. Certain retail space lease agreements also contain lease incentives, such as tenant improvement allowances and rent holidays. The Company recognizes the benefits related to the lease incentives on a straight-line basis over the applicable lease term.
Rent expense, including percentage rent, but excluding operating costs, for which the Company is obligated, was $25,220,000, $13,938,000 and $12,994,000 for non-related party leases during the years ended December 31, 2008, 2007 and 2006, respectively. Of these amounts $23,687,000, $12,504,000 and $11,749,000 were included as part of selling, general and administrative expense for the years ended December 31, 2008, 2007 and 2006, respectively, and $1,533,000, $1,434,000 and $1,245,000 were included as part of cost of goods sold for the years ended December 31, 2008, 2007 and 2006, respectively.
The Company leases certain operating facilities from a related party of the Company. Total rent expense for these leases was included as part of selling, general and administrative expense and amounted to $543,000, $583,000 and $515,000 for the years ended December 31, 2008, 2007 and 2006, respectively.
Approximate future minimum payments, including rent escalation clauses and stores that are not yet open, on all lease obligations at December 31, 2008, are as follows (in thousands). Future minimum payments listed below do not include percentage rent or operating costs for which the Company is obligated.
| Non-related Parties |
Related Party |
Total | |||||||
| 2009 |
$ | 21,134 | $ | 478 | $ | 21,612 | |||
| 2010 |
21,504 | 478 | 21,982 | ||||||
| 2011 |
19,871 | 478 | 20,349 | ||||||
| 2012 |
18,998 | — | 18,998 | ||||||
| 2013 |
18,613 | — | 18,613 | ||||||
| Thereafter |
133,565 | — | 133,565 | ||||||
| $ | 233,685 | $ | 1,434 | $ | 235,119 | ||||
58
COLUMBIA SPORTSWEAR COMPANY
NOTES TO CONSOLIDATED FINANCIAL STATEMENTS—(Continued)
Litigation
The Company is a party to various legal claims, actions and complaints from time to time. Although the ultimate resolution of legal proceedings cannot be predicted with certainty, management believes that disposition of these matters will not have a material adverse effect on the Company’s consolidated financial statements.
Off-Balance Sheet Arrangements
The Company has letters of credit outstanding for inventory purchase obligations. See Off-Balance Sheet Arrangements in Note 5.
Indemnities and Guarantees
During its normal course of business, the Company has made certain indemnities, commitments and guarantees under which it may be required to make payments in relation to certain transactions. These include (i) intellectual property indemnities to the Company’s customers and licensees in connection with the use, sale and/or license of Company products, (ii) indemnities to various lessors in connection with facility leases for certain claims arising from such facility or lease, (iii) indemnities to vendors and service providers pertaining to claims based on the negligence or willful misconduct of the Company, (iv) executive severance arrangements and (v) indemnities involving the accuracy of representations and warranties in certain contracts. The duration of these indemnities, commitments and guarantees varies, and in certain cases, may be indefinite. The majority of these indemnities, commitments and guarantees do not provide for any limitation of the maximum potential for future payments the Company could be obligated to make. The Company has not recorded any liability for these indemnities, commitments and guarantees in the accompanying Consolidated Balance Sheets.
NOTE 12—STOCK-BASED COMPENSATION
The following table shows total stock-based compensation expense included in the Consolidated Statement of Operations for the years ended December 31, (in thousands):
| 2008 | 2007 | 2006 | ||||||||||
| Cost of sales |
$ | 302 | $ | 415 | $ | 967 | ||||||
| Selling, general, and administrative expense |
6,000 | 6,830 | 9,113 | |||||||||
| Licensing |
— | 15 | 40 | |||||||||
| Pre-tax stock-based compensation expense |
6,302 | 7,260 | 10,120 | |||||||||
| Income tax benefits |
(2,088 | ) | (2,383 | ) | (3,434 | ) | ||||||
| Total stock-based compensation expense, net of tax |
$ | 4,214 | $ | 4,877 | $ | 6,686 | ||||||
No stock-based compensation costs were capitalized for the years ended December 31, 2008, 2007 and 2006.
The Company realized a tax benefit for the deduction from stock-based award transactions of $636,000, $4,213,000, and $4,984,000 for the years ended December 31, 2008, 2007 and 2006, respectively.
1997 Stock Incentive Plan
The Company’s 1997 Stock Incentive Plan (the “Plan”) provides for issuance of up to 7,400,000 shares of the Company’s Common Stock, of which 813,511 shares were available for future grants under the Plan at December 31, 2008. The Plan allows for grants of incentive stock options, non-statutory stock options, restricted stock awards, restricted stock units and other stock-based awards. The Company uses original issuance shares to satisfy share-based payments.
59
COLUMBIA SPORTSWEAR COMPANY
NOTES TO CONSOLIDATED FINANCIAL STATEMENTS—(Continued)
Stock Options
Options to purchase the Company’s common stock are granted at prices equal to or greater than the fair market value on the date of grant. Options granted prior to 2001 generally vest and become exercisable ratably over a period of five years from the date of grant and expire ten years from the date of grant. Options granted after 2000 generally vest and become exercisable over a period of four years (twenty-five percent on the first anniversary date following the date of grant and monthly thereafter) and expire ten years from the date of the grant, with the exception of most options granted in 2005. Most options granted in 2005 vested and became exercisable one year from the date of grant and expire ten years from the date of grant.
The Company estimates the fair value of stock options using the Black-Scholes model. Key input assumptions used to estimate the fair value of stock options include the exercise price of the award, the expected option term, the expected volatility of the Company’s stock over the option’s expected term, the risk-free interest rate over the option’s expected term, and the Company’s expected annual dividend yield. Assumptions are evaluated and revised as necessary to reflect changes in market conditions and the Company’s experience. Estimates of fair value are not intended to predict actual future events or the value ultimately realized by people who receive equity awards.
The following table shows the weighted average assumptions for the year ended December 31:
| 2008 | 2007 | 2006 | ||||
| Expected term |
4.43 years | 5.04 years | 5.13 years | |||
| Expected stock price volatility |
25.03% | 28.97% | 32.74% | |||
| Risk-free interest rate |
2.54% | 4.55% | 4.80% | |||
| Expected dividend yield (1) |
1.57% | 1.01% | — | |||
| Weighted average grant date fair value |
$ 8.60 | $ 18.87 | $ 18.29 |
| (1) | On November 30, 2006, the Company began paying a quarterly cash dividend. |
The following table summarizes stock option activity under the Plan:
| Number of Shares |
Weighted Average Exercise Price |
Weighted Average Remaining Contractual Life |
Aggregate Intrinsic Value (in thousands) | ||||||||
| Options outstanding at January 1, 2006 |
2,310,093 | $ | 39.07 | 5.47 | $ | 23,583 | |||||
| Granted |
189,636 | 48.57 | |||||||||
| Cancelled |
(239,332 | ) | 48.24 | ||||||||
| Exercised |
(681,247 | ) | 31.87 | ||||||||
| Options outstanding at December 31, 2006 |
1,579,150 | 41.93 | 6.78 | 21,761 | |||||||
| Granted |
263,272 | 61.44 | |||||||||
| Cancelled |
(81,160 | ) | 53.11 | ||||||||
| Exercised |
(402,845 | ) | 36.37 | ||||||||
| Options outstanding at December 31, 2007 |
1,358,417 | 46.70 | 6.54 | 4,497 | |||||||
| Granted |
640,008 | 40.98 | |||||||||
| Cancelled |
(228,300 | ) | 49.49 | ||||||||
| Exercised |
(116,486 | ) | 32.42 | ||||||||
| Options outstanding at December 31, 2008 |
1,653,639 | $ | 45.10 | 6.73 | $ | 1,042 | |||||
| Options vested and expected to vest at December 31, 2008 |
1,568,300 | $ | 45.08 | 6.64 | $ | 1,042 | |||||
| Options exercisable at December 31, 2008 |
903,580 | $ | 45.56 | 5.16 | $ | 1,042 | |||||
60
COLUMBIA SPORTSWEAR COMPANY
NOTES TO CONSOLIDATED FINANCIAL STATEMENTS—(Continued)
The aggregate intrinsic value in the table above represents pre-tax intrinsic value that would have been realized if all options had been exercised on the last business day of the period indicated, based on the Company’s closing stock price on that day. Total stock option compensation expense for the years ended December 31, 2008, 2007 and 2006 was $3,329,000, $4,417,000 and $9,297,000, respectively. At December 31, 2008, 2007 and 2006, unrecognized costs related to stock options totaled approximately $6,473,000, $6,515,000 and $7,099,000, respectively, before any related tax benefit. The unrecognized costs related to stock options are being amortized over the related vesting period using the straight-line attribution method. Unrecognized costs related to stock options at December 31, 2008 are expected to be recognized over a weighted average period of 2.80 years. The aggregate intrinsic value of stock options exercised was $1,071,000, $10,953,000 and $14,694,000 for the years ended December 31, 2008, 2007 and 2006, respectively. The total cash received as a result of stock option exercises for the years ended December 31, 2008, 2007 and 2006 was $3,731,000, $14,604,000 and $21,712,000, respectively.
Restricted Stock Units
Service-based restricted stock units are granted at no cost to key employees and generally vest over three years from the date of grant. Performance-based restricted stock units are granted at no cost to certain members of the Company’s senior executive team, excluding the Chairman and the President and Chief Executive Officer and generally vest over a performance period of between two and one-half and three years with an additional required service period of one year. Restricted stock units vest in accordance with the terms and conditions established by the Compensation Committee of the Board of Directors, and are based on continued service and, in some instances, on individual performance and /or Company performance.
The fair value of service-based and performance-based restricted stock units is discounted by the present value of the future stream of dividends over the vesting period using the Black-Scholes model. The relevant assumptions used in the Black-Scholes model to compute the discount are the vesting period, dividend yield and closing price of the Company’s common stock on the date of grant. Prior to 2007, the fair value of service-based and performance-based restricted stock units was determined based on the number of units granted and the closing price of the Company’s common stock on the date of grant. This change in valuation method is the result of the Company’s initiation of a quarterly cash dividend in the fourth quarter of 2006.
The following table presents the weighted average assumptions for the years ended December 31:
| 2008 | 2007 | |||
| Vesting period |
3.06 years | 3.11 years | ||
| Expected dividend yield |
1.56% | 1.01% | ||
| Estimated average fair value per restricted stock unit granted |
$ 39.27 | $ 60.16 |
For the year ended December 31, 2006, no assumptions are listed above because no restricted stock units were granted following the initiation of a quarterly cash dividend in the fourth quarter of 2006.
61
COLUMBIA SPORTSWEAR COMPANY
NOTES TO CONSOLIDATED FINANCIAL STATEMENTS—(Continued)
The following table summarizes the restricted stock unit activity under the Plan:
| Number of Shares |
Weighted Average Grant Date Fair Value Per Share | |||||
| Restricted stock units outstanding at January 1, 2006 |
— | $ | — | |||
| Granted |
110,227 | 49.07 | ||||
| Vested |
— | — | ||||
| Forfeited |
(10,539 | ) | 49.14 | |||
| Restricted stock units outstanding at December 31, 2006 |
99,688 | 49.06 | ||||
| Granted |
98,422 | 60.16 | ||||
| Vested |
(21,622 | ) | 49.79 | |||
| Forfeited |
(16,618 | ) | 53.72 | |||
| Restricted stock units outstanding at December 31, 2007 |
159,870 | 55.31 | ||||
| Granted |
168,347 | 39.27 | ||||
| Vested |
(20,625 | ) | 51.85 | |||
| Forfeited |
(47,083 | ) | 49.25 | |||
| Restricted stock units outstanding at December 31, 2008 |
260,509 | $ | 46.32 | |||
Restricted stock unit compensation expense for the years ended December 31, 2008, 2007 and 2006 was $2,973,000, $2,843,000 and $823,000, respectively. At December 31, 2008, 2007 and 2006, unrecognized costs related to restricted stock units totaled approximately $5,499,000, $5,963,000 and $3,706,000, respectively, before any related tax benefit. The unrecognized costs related to restricted stock units are being amortized over the related vesting period using the straight-line attribution method. These unrecognized costs at December 31, 2008 are expected to be recognized over a weighted average period of 1.76 years. The total grant date fair value of restricted stock units vested during the year ended December 31, 2008 and 2007 was $1,069,000 and $1,077,000, respectively. No restricted stock units vested during the year ended December 31, 2006.
1999 Employee Stock Purchase Plan
In 1999, the Company’s shareholders approved the 1999 Employee Stock Purchase Plan (“ESPP”). There are 750,000 shares of common stock authorized for issuance under the ESPP, which allows qualified employees of the Company to purchase shares on a quarterly basis up to fifteen percent of their respective compensation. The purchase price of the shares is equal to eighty five percent of the lesser of the closing price of the Company’s common stock on the first or last trading day of the respective quarter. Effective July 1, 2005, the Company suspended offerings under the ESPP indefinitely. As of December 31, 2008, a total of 275,556 shares of common stock had been issued under the ESPP.
NOTE 13—EARNINGS PER SHARE
SFAS No. 128, Earnings per Share requires dual presentation of basic and diluted earnings per share (“EPS”). Basic EPS is based on the weighted average number of common shares outstanding. Diluted EPS reflects the potential dilution that could occur if securities or other contracts to issue common stock were exercised or converted into common stock. For the calculation of diluted EPS, the basic weighted average number of shares is increased by the dilutive effect of stock options and restricted stock units determined using the treasury stock method.
62
COLUMBIA SPORTSWEAR COMPANY
NOTES TO CONSOLIDATED FINANCIAL STATEMENTS—(Continued)
A reconciliation of the common shares used in the denominator for computing basic and diluted EPS is as follows (in thousands, except per share amounts):
| Year Ended December 31, | |||||||||
| 2008 | 2007 | 2006 | |||||||
| Weighted average common shares outstanding, used in computing basic earnings per share |
34,610 | 36,106 | 36,245 | ||||||
| Effect of dilutive stock options and restricted stock units |
101 | 328 | 399 | ||||||
| Weighted-average common shares outstanding, used in computing diluted earnings per share |
34,711 | 36,434 | 36,644 | ||||||
| Earnings per share of common stock: |
|||||||||
| Basic |
$ | 2.75 | $ | 4.00 | $ | 3.39 | |||
| Diluted |
2.74 | 3.96 | 3.36 | ||||||
Stock options and service-based restricted stock units representing 1,410,849, 354,342 and 612,603 shares of common stock were outstanding for the years ended December 31, 2008, 2007 and 2006, respectively, but these shares were excluded in the computation of diluted EPS because their effect would be anti-dilutive. In addition, performance-based restricted stock units representing 41,799, 24,318 and 5,221 shares for the years ended December 31, 2008, 2007 and 2006, respectively, were excluded from the computation of diluted EPS, as these shares were subject to performance conditions that had not been met.
Since the inception of the Company’s stock repurchase plan in 2004 through December 31, 2008, the Company’s Board of Directors has authorized the repurchase of $500,000,000 of the Company’s common stock. As of December 31, 2008, the Company has repurchased 8,694,657 shares under this program at an aggregate purchase price of approximately $400,000,000. During the year ended December 31, 2008, the Company repurchased an aggregate of $83,865,000 of the Company’s common stock under the stock repurchase plan, of which $58,982,000 was recorded as a reduction to total retained earnings; otherwise, the aggregate purchase price would have resulted in a negative common stock carrying amount. Shares of the Company’s common stock may be purchased in the open market or through privately negotiated transactions, subject to market conditions. The repurchase program does not obligate the Company to acquire any specific number of shares or to acquire shares over any specified period of time.
NOTE 14—COMPREHENSIVE INCOME
Accumulated other comprehensive income, net of applicable taxes, reported on the Company’s Consolidated Balance Sheets consists of foreign currency translation adjustments and the unrealized gains and losses on derivative transactions. A summary of comprehensive income, net of related tax effects, for the year ended December 31, is as follows (in thousands):
| 2008 | 2007 | 2006 | ||||||||||
| Net income |
$ | 95,047 | $ | 144,452 | $ | 123,018 | ||||||
| Other comprehensive income (loss): |
||||||||||||
| Unrealized derivative holding gains (losses) arising during period (net of tax expense (benefit) of $361, ($796) and $63 in 2008, 2007 and 2006, respectively) |
6,425 | (844 | ) | (2,599 | ) | |||||||
| Reclassification to net income of previously deferred (gains) losses on derivative transactions (net of tax benefit of ($36), ($608) and ($576) in 2008, 2007 and 2006, respectively) |
(389 | ) | (1,303 | ) | 864 | |||||||
| Foreign currency translation adjustments |
(30,511 | ) | 25,394 | 11,167 | ||||||||
| Other comprehensive income (loss) |
(24,475 | ) | 23,247 | 9,432 | ||||||||
| Comprehensive income |
$ | 70,572 | $ | 167,699 | $ | 132,450 | ||||||
63
COLUMBIA SPORTSWEAR COMPANY
NOTES TO CONSOLIDATED FINANCIAL STATEMENTS—(Continued)
NOTE 15—SEGMENT INFORMATION
The Company operates in four geographic segments: (1) United States, (2) Europe, Middle East and Africa (“EMEA”), (3) Latin America and Asia Pacific (“LAAP”), and (4) Canada, which are reflective of the Company’s internal organization, management, and oversight structure. Each geographic segment operates predominantly in one industry: the design, production, marketing and selling of active outdoor apparel, including sportswear, outerwear, footwear, and related accessories and equipment.
In 2007, the Company reclassified its geographical net sales and segment reporting to reflect changes in its internal management and oversight structure as well as growth of the international distributor business. Net sales to international distributors, previously included as part of “Other International,” have been regrouped into either the EMEA or LAAP region, in accordance with the markets in which each respective distributor operates. Previously reported geographical net sales information for fiscal year 2006 has been reclassified to reflect this change.
The geographic distribution of the Company’s net sales, income before income tax, interest income (expense), income tax expense (benefit), depreciation and amortization expense, identifiable assets and goodwill are summarized in the following tables (in thousands) for, and for the years ended, December 31, 2008, 2007 and 2006. In addition to the geographic distribution of net sales, the Company’s net sales by major product line are also summarized below. Inter-geographic net sales, which are recorded at a negotiated mark-up and eliminated in consolidation, are not material.
| 2008 | 2007 | 2006 | ||||||||||
| Net sales to unrelated entities: |
||||||||||||
| United States |
$ | 727,706 | $ | 767,198 | $ | 751,984 | ||||||
| EMEA |
267,152 | 286,968 | 272,605 | |||||||||
| LAAP |
198,236 | 175,725 | 142,844 | |||||||||
| Canada |
124,741 | 126,148 | 120,239 | |||||||||
| $ | 1,317,835 | $ | 1,356,039 | $ | 1,287,672 | |||||||
| Income before income tax: |
||||||||||||
| United States |
$ | 38,674 | $ | 112,986 | $ | 106,172 | ||||||
| EMEA |
26,167 | 29,210 | 25,465 | |||||||||
| LAAP |
32,857 | 29,585 | 24,437 | |||||||||
| Canada |
21,008 | 27,195 | 23,394 | |||||||||
| Interest and other income and eliminations |
7,537 | 9,051 | 5,867 | |||||||||
| $ | 126,243 | $ | 208,027 | $ | 185,335 | |||||||
| Interest income (expense), net: |
||||||||||||
| United States |
$ | 5,804 | $ | 9,602 | $ | 7,855 | ||||||
| EMEA |
45 | (1,856 | ) | (2,486 | ) | |||||||
| LAAP |
1,023 | 482 | 276 | |||||||||
| Canada |
665 | 660 | (83 | ) | ||||||||
| $ | 7,537 | $ | 8,888 | $ | 5,562 | |||||||
| Income tax expense: |
||||||||||||
| United States |
$ | (13,363 | ) | $ | (41,227 | ) | $ | (47,631 | ) | |||
| EMEA |
(2,692 | ) | (5,185 | ) | (236 | ) | ||||||
| LAAP |
(8,312 | ) | (7,084 | ) | (6,299 | ) | ||||||
| Canada |
(6,829 | ) | (10,079 | ) | (8,151 | ) | ||||||
| $ | (31,196 | ) | $ | (63,575 | ) | $ | (62,317 | ) | ||||
64
COLUMBIA SPORTSWEAR COMPANY
NOTES TO CONSOLIDATED FINANCIAL STATEMENTS—(Continued)
| 2008 | 2007 | 2006 | ||||||||||
| Depreciation and amortization expense: |
||||||||||||
| United States |
$ | 21,866 | $ | 18,643 | $ | 15,765 | ||||||
| EMEA |
6,978 | 9,910 | 6,397 | |||||||||
| LAAP |
1,865 | 1,540 | 952 | |||||||||
| Canada |
449 | 245 | 433 | |||||||||
| $ | 31,158 | $ | 30,338 | $ | 23,547 | |||||||
| Assets: |
||||||||||||
| United States |
$ | 857,228 | $ | 872,027 | $ | 808,519 | ||||||
| EMEA |
246,072 | 239,007 | 195,826 | |||||||||
| LAAP |
93,773 | 78,308 | 80,436 | |||||||||
| Canada |
89,463 | 97,815 | 71,240 | |||||||||
| Total identifiable assets |
1,286,536 | 1,287,157 | 1,156,021 | |||||||||
| Eliminations and reclassifications |
(138,300 | ) | (120,676 | ) | (128,732 | ) | ||||||
| Total assets |
$ | 1,148,236 | $ | 1,166,481 | $ | 1,027,289 | ||||||
| Goodwill: |
||||||||||||
| United States |
$ | 12,157 | $ | 16,771 | $ | 16,996 | ||||||
| EMEA |
502 | 502 | 502 | |||||||||
| LAAP |
— | — | — | |||||||||
| Canada |
— | — | — | |||||||||
| $ | 12,659 | $ | 17,273 | $ | 17,498 | |||||||
| Net sales to unrelated entities: |
||||||||||||
| Sportswear |
$ | 540,903 | $ | 565,591 | $ | 509,134 | ||||||
| Outerwear |
491,777 | 497,551 | 496,509 | |||||||||
| Footwear |
217,237 | 227,434 | 219,640 | |||||||||
| Accessories and equipment |
67,918 | 65,463 | 62,389 | |||||||||
| $ | 1,317,835 | $ | 1,356,039 | $ | 1,287,672 | |||||||
NOTE 16— FINANCIAL INSTRUMENTS AND RISK MANAGEMENT
As part of the Company’s risk management programs, the Company uses a variety of financial instruments, including foreign currency option and forward contracts. The Company does not hold or issue derivative financial instruments for trading purposes.
The Company hedges against the foreign currency risk associated with anticipated transactions for approximately the next twelve months denominated in European euros, Canadian dollars and Japanese yen. The Company accounts for these instruments as cash flow hedges. In accordance with SFAS No. 133, Accounting for Derivative Instruments and Hedging Activities, as amended, these financial instruments are marked to market with the effective portion offset to accumulated other comprehensive income and any ineffective portion offset to current earnings. Amounts accumulated in other comprehensive income are subsequently amortized to cost of goods sold when the underlying transaction is included in earnings. Hedge effectiveness is determined by evaluating the ability of a hedging instrument’s cumulative change in fair value to offset the cumulative change in the present value of expected cash flows on the underlying exposures. Hedge ineffectiveness was not material during the years ended December 31, 2008, 2007 and 2006.
65
COLUMBIA SPORTSWEAR COMPANY
NOTES TO CONSOLIDATED FINANCIAL STATEMENTS—(Continued)
In the normal course of business, the Company’s financial position and results of operations are routinely subject to a variety of risks, including market risk associated with interest rate movements on borrowings and investments and currency rate movements on non-U.S. dollar currency denominated assets, liabilities and income. The Company regularly assesses these risks and has established policies and business practices that serve to mitigate these potential exposures. The Company does not enter into foreign currency or interest rate transactions for speculative purposes.
The Company’s foreign currency risk management objective is to mitigate the uncertainty of anticipated cash flows attributable to changes in exchange rates. Particular focus is put on anticipated cash flows resulting from anticipated inventory purchases and the related receivables and payables, including third party or intercompany transactions.
The Company manages this risk primarily by using currency forward exchange contracts and options. Anticipated transactions that are hedged carry a high level of certainty and are expected to be recognized within one year. The Company uses cross-currency swaps to hedge foreign currency denominated payments related to intercompany loan agreements. Hedged transactions are denominated primarily in euros, Canadian dollars and yen. The Company attempts to mitigate foreign currency risk through hedging practices. However, if recent foreign currency exchange rate volatility continues, it is reasonably possible that the Company could experience a materially adverse effect on the cost of goods sold during the next twelve months.
At December 31, 2008 and 2007, the notional value of outstanding forward contracts was approximately $60,000,000 and $90,500,000, respectively. At December 31, 2008, $2,477,000 of deferred gains (net of tax) on both outstanding and matured derivatives accumulated in other comprehensive income are expected to be reclassified to net income during the next twelve months as a result of underlying hedged transactions also being recorded in net income. Actual amounts ultimately reclassified to net income are dependent on the exchange rates in effect when derivative contracts that are currently outstanding mature.
NOTE 17—FAIR VALUE MEASURES
The Company adopted the provisions of SFAS No. 157 effective January 1, 2008. SFAS No. 157 defines fair value, establishes a consistent framework for measuring fair value, and expands disclosures for each major asset and liability category measured at fair value on either a recurring or nonrecurring basis. SFAS No. 157 clarifies that fair value is an exit price, representing the amount that would be received to sell an asset or paid to transfer a liability in an orderly transaction between market participants. SFAS No. 157 establishes a three-tier fair value hierarchy which prioritizes the inputs used in measuring fair value as follows:
| Level 1 – | observable inputs such as quoted prices in active markets; | |
| Level 2 – | inputs, other than the quoted market prices in active markets, which are observable, either directly or indirectly; and | |
| Level 3 – | unobservable inputs for which there is little or no market data available, which require the reporting entity to develop its own assumptions. | |
66
COLUMBIA SPORTSWEAR COMPANY
NOTES TO CONSOLIDATED FINANCIAL STATEMENTS—(Continued)
Assets and liabilities measured at fair value on a recurring basis as of December 31, 2008 are as follows (in thousands):
| Total | Level 1 (1) | Level 2 (2) | Level 3 | ||||||||
| Assets: |
|||||||||||
| Cash and cash equivalents |
$ | 230,617 | $ | 230,617 | $ | — | — | ||||
| Short-term investments |
22,433 | 22,433 | — | — | |||||||
| Derivative financial instruments |
2,603 | — | 2,603 | — | |||||||
| Liabilities: |
|||||||||||
| Derivative financial instruments |
494 | — | 494 | — | |||||||
| (1) | Level 1 assets include money market funds and certificates of deposit which cost approximates fair value. |
| (2) | Level 2 assets and liabilities include derivative financial instruments which are valued based on significant observable inputs. See Note 14 and Note 16 for further discussion. |
There were no assets and liabilities measured at fair value on a nonrecurring basis.
67
SUPPLEMENTARY DATA—QUARTERLY FINANCIAL DATA (Unaudited)
The following table summarizes the Company’s quarterly financial data for the past two years ended December 31, 2008 (in thousands, except per share amounts):
| 2008 |
First Quarter |
Second Quarter |
Third Quarter |
Fourth Quarter | |||||||||
| Net sales |
$ | 297,363 | $ | 213,147 | $ | 452,415 | $ | 354,910 | |||||
| Gross profit |
130,555 | 85,765 | 202,053 | 149,438 | |||||||||
| Net income (loss) |
19,931 | (1,770 | ) | 58,329 | 18,557 | ||||||||
| Earnings (loss) per share |
|||||||||||||
| Basic |
$ | 0.56 | $ | (0.05 | ) | $ | 1.70 | $ | 0.55 | ||||
| Diluted |
0.56 | (0.05 | ) | 1.69 | 0.55 | ||||||||
| 2007 |
First Quarter |
Second Quarter |
Third Quarter |
Fourth Quarter | ||||||||
| Net sales |
$ | 289,640 | $ | 218,560 | $ | 471,081 | $ | 376,758 | ||||
| Gross profit |
126,698 | 90,575 | 203,531 | 158,947 | ||||||||
| Net income |
26,086 | 10,037 | 62,609 | 45,720 | ||||||||
| Earnings per share |
||||||||||||
| Basic |
$ | 0.72 | $ | 0.28 | $ | 1.73 | $ | 1.27 | ||||
| Diluted |
0.71 | 0.27 | 1.72 | 1.26 | ||||||||
| Item 9. | CHANGES IN AND DISAGREEMENTS WITH ACCOUNTANTS ON ACCOUNTING AND FINANCIAL DISCLOSURE |
None.
| Item 9A. | CONTROLS AND PROCEDURES |
Evaluation of Disclosure Controls and Procedures
Our management has evaluated, under the supervision and with the participation of our chief executive officer and chief financial officer, the effectiveness of our disclosure controls and procedures as of the end of the period covered by this report pursuant to Rule 13a-15(b) under the Securities Exchange Act of 1934 (the “Exchange Act”). Based on that evaluation, our chief executive officer and chief financial officer have concluded that, as of the end of the period covered by this report, our disclosure controls and procedures are effective in ensuring that information required to be disclosed in our Exchange Act reports is (1) recorded, processed, summarized and reported in a timely manner, and (2) accumulated and communicated to our management, including our chief executive officer and chief financial officer, as appropriate to allow timely decisions regarding required disclosure.
Design and Evaluation of Internal Control Over Financial Reporting
Report of Management
Our management is responsible for establishing and maintaining adequate internal control over financial reporting. All internal control systems, no matter how well designed, have inherent limitations. Therefore, even those systems determined to be effective can provide only reasonable assurance with respect to financial statement preparation and presentation.
Under the supervision and with the participation of our management, we assessed the effectiveness of our internal control over financial reporting as of December 31, 2008. In making this assessment, we used the criteria set forth by the Committee of Sponsoring Organizations of the Treadway Commission in Internal Control—Integrated Framework. Based on our assessment we believe that, as of December 31, 2008, the Company’s internal control over financial reporting is effective based on those criteria.
68
There has been no change in our internal control over financial reporting that occurred during our fiscal quarter ended December 31, 2008 that has materially affected, or is reasonably likely to materially affect, our internal control over financial reporting.
Our independent auditors have issued an audit report on the effectiveness of our internal control over financial reporting as of December 31, 2008, which is included herein.
Report of Independent Registered Public Accounting Firm
To the Board of Directors and Shareholders
Columbia Sportswear Company
Portland, Oregon
We have audited the internal control over financial reporting of Columbia Sportswear Company and subsidiaries (the “Company”) as of December 31, 2008, based on criteria established in Internal Control—Integrated Framework issued by the Committee of Sponsoring Organizations of the Treadway Commission. The Company’s management is responsible for maintaining effective internal control over financial reporting and for its assessment of the effectiveness of internal control over financial reporting, included in the accompanying “Report of Management”. Our responsibility is to express an opinion on the Company’s internal control over financial reporting based on our audit.
We conducted our audit in accordance with the standards of the Public Company Accounting Oversight Board (United States). Those standards require that we plan and perform the audit to obtain reasonable assurance about whether effective internal control over financial reporting was maintained in all material respects. Our audit included obtaining an understanding of internal control over financial reporting, assessing the risk that a material weakness exists, testing and evaluating the design and operating effectiveness of internal control based on the assessed risk, and performing such other procedures as we considered necessary in the circumstances. We believe that our audit provides a reasonable basis for our opinion.
A company’s internal control over financial reporting is a process designed by, or under the supervision of, the company’s principal executive and principal financial officers, or persons performing similar functions, and effected by the company’s board of directors, management, and other personnel to provide reasonable assurance regarding the reliability of financial reporting and the preparation of financial statements for external purposes in accordance with generally accepted accounting principles. A company’s internal control over financial reporting includes those policies and procedures that (1) pertain to the maintenance of records that, in reasonable detail, accurately and fairly reflect the transactions and dispositions of the assets of the company; (2) provide reasonable assurance that transactions are recorded as necessary to permit preparation of financial statements in accordance with generally accepted accounting principles, and that receipts and expenditures of the company are being made only in accordance with authorizations of management and directors of the company; and (3) provide reasonable assurance regarding prevention or timely detection of unauthorized acquisition, use, or disposition of the company’s assets that could have a material effect on the financial statements.
Because of the inherent limitations of internal control over financial reporting, including the possibility of collusion or improper management override of controls, material misstatements due to error or fraud may not be prevented or detected on a timely basis. Also, projections of any evaluation of the effectiveness of the internal control over financial reporting to future periods are subject to the risk that the controls may become inadequate because of changes in conditions, or that the degree of compliance with the policies or procedures may deteriorate.
In our opinion, the Company maintained, in all material respects, effective internal control over financial reporting as of December 31, 2008, based on the criteria established in Internal Control—Integrated Framework issued by the Committee of Sponsoring Organizations of the Treadway Commission.
69
We have also audited, in accordance with the standards of the Public Company Accounting Oversight Board (United States), the consolidated financial statements and financial statement schedule as of and for the year ended December 31, 2008 of the Company and our report dated February 27, 2009 expressed an unqualified opinion on those financial statements and financial statement schedule.
DELOITTE & TOUCHE LLP
Portland, Oregon
February 27, 2009
| Item 9B. | OTHER INFORMATION |
None.
70
PART III
| Item 10. | DIRECTORS, EXECUTIVE OFFICERS AND CORPORATE GOVERNANCE |
The sections of our 2009 Proxy Statement entitled “Election of Directors,” “Corporate Governance—Corporate Governance Guidelines,” “Corporate Governance—Board Committees” and “Section 16(a) Beneficial Ownership Reporting Compliance” are incorporated herein by reference.
See Item 4A of this Annual Report on Form 10-K for information regarding our executive officers.
| Item 11. | EXECUTIVE COMPENSATION |
The sections of our 2009 Proxy Statement entitled “Executive Compensation,” “Corporate Governance—Compensation Committee Interlocks and Insider Participation” and “Compensation Committee Report” are incorporated herein by reference.
| Item 12. | SECURITY OWNERSHIP OF CERTAIN BENEFICIAL OWNERS AND MANAGEMENT AND RELATED STOCKHOLDER MATTERS |
The section of our 2009 Proxy Statement entitled “Security Ownership of Certain Beneficial Owners and Management” is incorporated herein by reference.
The following table provides information about compensation plans (including individual compensation arrangements) under which our equity securities are authorized for issuance to employees or non-employees (such as directors and consultants), at December 31, 2008:
Equity Compensation Plan information
| Plan Category |
Number of securities to be issued upon exercise of outstanding options, warrants and rights (1) |
Weighted-average exercise price of outstanding options, warrants and rights (2) |
Number of securities remaining available for future issuance under equity compensation plans (excluding securities reflected in column a) | ||||
| (a) | (b) | (c) | |||||
| Equity compensation plans approved by security holders: |
|||||||
| 1997 Stock Incentive Plan |
1,914,148 | $ | 45.10 | 813,511 | |||
| 1999 Employee Stock Purchase Plan (3) |
— | — | 474,444 | ||||
| Equity compensation plans not approved by security holders |
— | — | — | ||||
| Total |
1,914,148 | $ | 45.10 | 1,287,955 | |||
| (1) | The number of outstanding shares to be issued under the 1997 Stock Incentive Plan includes stock options and restricted stock units. |
| (2) | The weighted-average exercise price excludes 260,509 shares issuable upon the vesting of outstanding restricted stock units, which have no exercise price. |
| (3) | The 1999 Employee Stock Purchase Plan was suspended indefinitely effective July 1, 2005. |
71
| Item 13. | CERTAIN RELATIONSHIPS, RELATED TRANSACTIONS, AND DIRECTOR INDEPENDENCE |
The sections of our 2009 Proxy Statement entitled “Corporate Governance—Certain Relationships and Related Transactions,” “Corporate Governance—Related Transactions Approval Process,” and “Corporate Governance—Corporate Governance Guidelines” are incorporated herein by reference.
| Item 14. | PRINCIPAL ACCOUNTANT FEES AND SERVICES |
The section of our 2009 Proxy Statement entitled “Principal Accountant Fees and Services” is incorporated herein by reference.
72
PART IV
| Item 15. | EXHIBITS AND FINANCIAL STATEMENT SCHEDULE |
(a)(1) and (a)(2) Financial Statements. The Financial Statements of Columbia and Supplementary Data filed as part of this Annual Report on Form 10-K are on pages 41 to 67 of this Annual Report.
(b) See Exhibit Index beginning on page 76 for a description of the documents that are filed as Exhibits to this Annual Report on Form 10-K or incorporated herein by reference.
In reviewing the agreements included as exhibits to this Annual Report on Form 10-K, please remember they are included to provide you with information regarding their terms and are not intended to provide any other factual or disclosure information about Columbia or the other parties to the agreements. The agreements may contain representations and warranties by each of the parties to the applicable agreement. These representations and warranties have been made solely for the benefit of the other party or parties to the applicable agreement and:
| • | should not in all instances be treated as categorical statements of fact, but rather as a means of allocating the risk to one of the parties if those statements prove to be inaccurate; |
| • | may have been qualified by disclosures that were made to the other party or parties in connection with the negotiation of the applicable agreement, which disclosures are not necessarily reflected in the agreement; |
| • | may apply standards of materiality in a manner that is different from what may be viewed as material to you or other investors; and |
| • | were made only as of the date of the applicable agreement or other date or dates that may be specified in the agreement and are subject to more recent developments. |
Accordingly, there representations and warranties may not describe the actual state of affairs as of the date they were made or at any other time. Additional information about Columbia may be found elsewhere in this Annual Report on Form 10-K and Columbia’s other public filings, which are available without charge through the SEC’s website at http://www.sec.gov.
73
Schedule II
Valuation and Qualifying Accounts
(in thousands)
| Description |
Balance at Beginning of Period |
Charged to Costs and Expenses |
Deductions (a) |
Other (b) |
Balance at End of Period | ||||||||||||
| Year Ended December 31, 2008: |
|||||||||||||||||
| Allowance for doubtful accounts |
$ | 7,369 | $ | 3,473 | $ | (940 | ) | $ | (360 | ) | $ | 9,542 | |||||
| Product warranty |
10,862 | 2,718 | (3,364 | ) | (470 | ) | 9,746 | ||||||||||
| Year Ended December 31, 2007: |
|||||||||||||||||
| Allowance for doubtful accounts |
$ | 6,732 | $ | 950 | $ | (612 | ) | $ | 299 | $ | 7,369 | ||||||
| Product warranty |
11,162 | 2,269 | (3,128 | ) | 559 | 10,862 | |||||||||||
| Year Ended December 31, 2006: |
|||||||||||||||||
| Allowance for doubtful accounts |
$ | 7,340 | $ | 57 | $ | (783 | ) | $ | 118 | $ | 6,732 | ||||||
| Product warranty |
9,907 | 4,804 | (3,827 | ) | 278 | 11,162 | |||||||||||
| (a) | Charges to the accounts included in this column are for the purposes for which the reserves were created. |
| (b) | Amounts included in this column primarily relate to foreign currency translation. |
74
Pursuant to the requirements of Section 13 or 15(d) of the Securities Exchange Act of 1934, the registrant has duly caused this report to be signed on its behalf by the undersigned, thereunto duly authorized.
| COLUMBIA SPORTSWEAR COMPANY | ||
| By: |
/s/ THOMAS B. CUSICK | |
| Thomas B. Cusick Vice President, Chief Financial Officer and Treasurer | ||
Date: February 27, 2009
Pursuant to the requirements of the Securities Exchange Act of 1934, this report has been signed below by the following persons on behalf of the registrant and in the capacities and on the date indicated.
| Signatures |
Title | |
| /s/ TIMOTHY P. BOYLE Timothy P. Boyle |
President and Chief Executive Officer and Director (Principal Executive Officer) | |
| /s/ THOMAS B. CUSICK Thomas B. Cusick |
Vice President, Chief Financial Officer and Treasurer (Principal Financial and Accounting Officer) | |
| /s/ GERTRUDE BOYLE Gertrude Boyle |
Chairman of the Board of Directors | |
| /s/ SARAH A. BANY Sarah A. Bany |
Director | |
| /s/ EDWARD S. GEORGE Edward S. George |
Director | |
| /s/ MURREY R. ALBERS Murrey R. Albers |
Director | |
| /s/ JOHN W. STANTON John W. Stanton |
Director | |
| /s/ WALTER T. KLENZ Walter T. Klenz |
Director | |
| /s/ STEPHEN E. BABSON Stephen E. Babson |
Director | |
| /s/ ANDY D. BRYANT Andy D. Bryant |
Director | |
Date: February 27, 2009
75
In reviewing the agreements included as exhibits to this Annual Report on Form 10-K, please remember they are included to provide you with information regarding their terms and are not intended to provide any other factual or disclosure information about Columbia or the other parties to the agreements. The agreements may contain representations and warranties by each of the parties to the applicable agreement. These representations and warranties have been made solely for the benefit of the other party or parties to the applicable agreement and:
| • | should not in all instances be treated as categorical statements of fact, but rather as a means of allocating the risk to one of the parties if those statements prove to be inaccurate; |
| • | may have been qualified by disclosures that were made to the other party or parties in connection with the negotiation of the applicable agreement, which disclosures are not necessarily reflected in the agreement; |
| • | may apply standards of materiality in a manner that is different from what may be viewed as material to you or other investors; and |
| • | were made only as of the date of the applicable agreement or other date or dates that may be specified in the agreement and are subject to more recent developments. |
Accordingly, there representations and warranties may not describe the actual state of affairs as of the date they were made or at any other time. Additional information about Columbia may be found elsewhere in this Annual Report on Form 10-K and Columbia’s other public filings, which are available without charge through the SEC’s website at http://www.sec.gov.
| Exhibit Index |
||
| 3.1 | Third Restated Articles of Incorporation (incorporated by reference to exhibit 3.1 to the Company’s Quarterly Report on Form 10-Q for the quarterly period ended March 31,
2000) (File No. 000-23939) | |
| 3.2 | 2000 Restated Bylaws (incorporated by reference to exhibit 3.2 to the Company’s Quarterly Report on Form 10-Q for the quarterly period ended March 31, 2000) (File No. 000-23939) | |
| 4.1 | See Article II of Exhibit 3.1 and Article I of Exhibit 3.2 | |
| +10.1 | 1997 Stock Incentive Plan, as amended (incorporated by reference to Appendix B to the Company’s proxy statement filed on April 9, 2004) | |
| +10.1a | 1997 Stock Incentive Plan, as amended January 23, 2009 | |
| +*10.2 | Form of Nonstatutory Stock Option Agreement for stock options granted prior to July 20, 2006 | |
| +10.2(a) | Form of Executive Stock Option Agreement (incorporated by reference to exhibit 10.3 (a) to the Company’s Annual Report on Form 10-K for the year ended December 31, 2000) (File No. 000-23939) | |
| +10.2(b) | Form of Nonstatutory Stock Option Agreement for stock options granted on or after July 20, 2006 and before January 23, 2009 (incorporated by reference to exhibit 99.1 to the Company’s Form 8-K filed on July 20, 2006) | |
| +10.2(c) | Form of Restricted Stock Unit Award Agreement for awards granted prior to January 23, 2009 (incorporated by reference to exhibit 99.2 to the Company’s Form 8-K filed on July 20, 2006) | |
| +10.2(d) | Form of Performance-Based Restricted Stock Unit Award Agreement (incorporated by reference to exhibit 99.3 to the Company’s Form 8-K filed on July 20, 2006) | |
| +10.2(e) | Form of Nonstatutory Stock Option Agreement for stock options granted on or after January 23, 2009 | |
| +10.2(f) | Form of Restricted Stock Unit Award Agreement for awards granted on or after January 23, 2009 | |
| 10.5 | Credit Agreement between the Company and Wells Fargo Bank National Association dated December 16, 2004 (incorporated by reference to the Company’s Annual Report on Form 10-K for the year ended December 31, 2004) | |
76
| Exhibit Index |
||
| 10.5(a) | First Amendment to Credit Agreement between the Company and Wells Fargo Bank National Association dated December 22, 2005 (incorporated by reference to the Company’s Form 8-K filed on December 27, 2005) | |
| 10.5(b) | Second Amendment to Credit Agreement between the Company and Wells Fargo Bank National Association dated December 22, 2005 (incorporated by reference to the Company’s Form 8-K filed on October 27, 2006) | |
| 10.5(c) | Third Amendment to Credit Agreement between the Company and Wells Fargo Bank National Association dated June 26, 2007 (incorporated by reference to the Company’s Form 8-K filed on July 2, 2007) | |
| 10.5(d) | Fourth Amendment to Credit Agreement between the Company and Wells Fargo Bank National Association dated October 31, 2008 (incorporated by reference to the Company’s Form 10-Q filed on November 6, 2008) | |
| 10.6 | Continuing Letter of Credit Agreement between The Hong Kong and Shanghai Banking Corporation Limited and the Company dated May 21, 2007 (incorporated by reference to the Company’s Form 8-K filed on May 22, 2007) | |
| *10.7 | Lease between BB&S Development Company and the Company, dated February 12, 1996 | |
| *10.8 | Lease between B.A.R.K. Holdings, Inc. and Columbia Sportswear Canada Limited, dated January 3, 1994 | |
| 10.9 | Lease Amending Agreement between B.A.R.K. Holdings, Inc. and Columbia Sportswear Canada Limited, dated January 1, 2002 (incorporated by reference to exhibit 10.12 (a) to the Company’s Annual Report on Form 10-K for the year ended December 31, 2001) (File No. 000-23939) | |
| 10.9(a) | Indemnity Agreement between Columbia Sportswear Company and B.A.R.K. Holdings, Inc., dated January 1, 2002 (incorporated by reference to exhibit 10.12 (b) to the Company’s Annual Report on Form 10-K for the year ended December 31, 2001) (File No. 000-23939 | |
| +10.10 | Consulting and Confidentiality Agreement between Robert Masin and the Company dated as of September 1, 2006 (incorporated by reference to the Company’s 8-K filed on September 1, 2006) | |
| *10.11 | Form of Indemnity Agreement for Directors | |
| *10.12 | Form of Agreement Regarding Plan of Recapitalization Among the Company and Shareholders | |
| +10.13 | 1999 Employee Stock Purchase Plan, as amended (incorporated by reference to exhibit 10.21 to the Company’s Annual Report on Form 10-K for the year ended December 31, 2001) (File No. 000-23939) | |
| +10.14 | Executive Incentive Compensation Plan, as amended (incorporated by reference to exhibit 10.1 to the Company’s Quarterly Report on Form 10-Q for the quarterly period ended March 31, 2000) (File No. 000-23939) | |
| +10.15 | Form of Indemnity Agreement for Directors and Executive Officers (incorporated by reference to exhibit 10.23 to the Company’s Annual Report on Form 10-K for the year ended December 31, 2004) | |
| +10.16 | Severance Agreement entered into as of May 19, 2008, by and between Patrick D. Anderson and Columbia Sportswear Company (incorporated by reference to exhibit 10.1 to the Company’s Current Report on Form 8-K filed May 23, 2008). | |
| 21.1 | Subsidiaries of the Company | |
| 23.1 | Consent of Deloitte & Touche LLP | |
| 31.1 | Rule 13a-14(a) Certification of Timothy P. Boyle, President and Chief Executive Officer | |
| 31.2 | Rule 13a-14(a) Certification of Thomas B. Cusick, Vice President, Chief Financial Officer and Treasurer | |
77
| Exhibit Index |
||
| 32.1 | Section 1350 Certification of Timothy P. Boyle, President and Chief Executive Officer | |
| 32.2 | Section 1350 Certification of Thomas B. Cusick, Vice President, Chief Financial Officer and Treasurer | |
| + | Management Contract or Compensatory Plan |
| * | Incorporated by reference to the Company’s Registration Statement on Form S-1 (Reg. No. 333-43199). |
78